Visa’s moat is indisputable.
For forty years, Visa and Mastercard have operated the world’s open-loop card systems, and no third entrant has emerged.
What’s disputed is the price of using it. For the first time, that dispute has the backing of the White House, a Justice Department complaint, and a British consortium with £50 million in seed money.
The dividend is $2.68 a share, yields 0.73%, and is up 13.6% since last October. It is funded by $21.0 billion in trailing free cash flow and consumes just 23.8% of it.
The dividend is secure for the next decade. The only question is how quickly it will grow.
1. Business & Moat
Visa moves money between a cardholder’s bank and a merchant’s bank. It doesn’t lend, hold deposits, or take on credit risk.
It sells three things:
the right to use its brand and rules (service revenue, a percentage of payment volume)
the act of authorizing, clearing, and settling each transaction (data processing, a fee per transaction)
cross-border handling (international transaction revenue)
Recently, it added a fourth bucket, value-added services (VAS). This includes fraud tools, tokenization, consulting, and issuer processing. VAS now accounts for 27% of net revenue.
Two-sided network
The moat comes from a two-sided network effect: each additional cardholder makes Visa more valuable to merchants, and each new merchant makes the card more useful to carry.
At Visa’s current scale, the network effect protects the network more than it expands it. Acceptance is already nearly universal in developed markets, so each additional merchant adds little there. In markets where the shift from cash to cards is still underway, new merchants continue to add value.
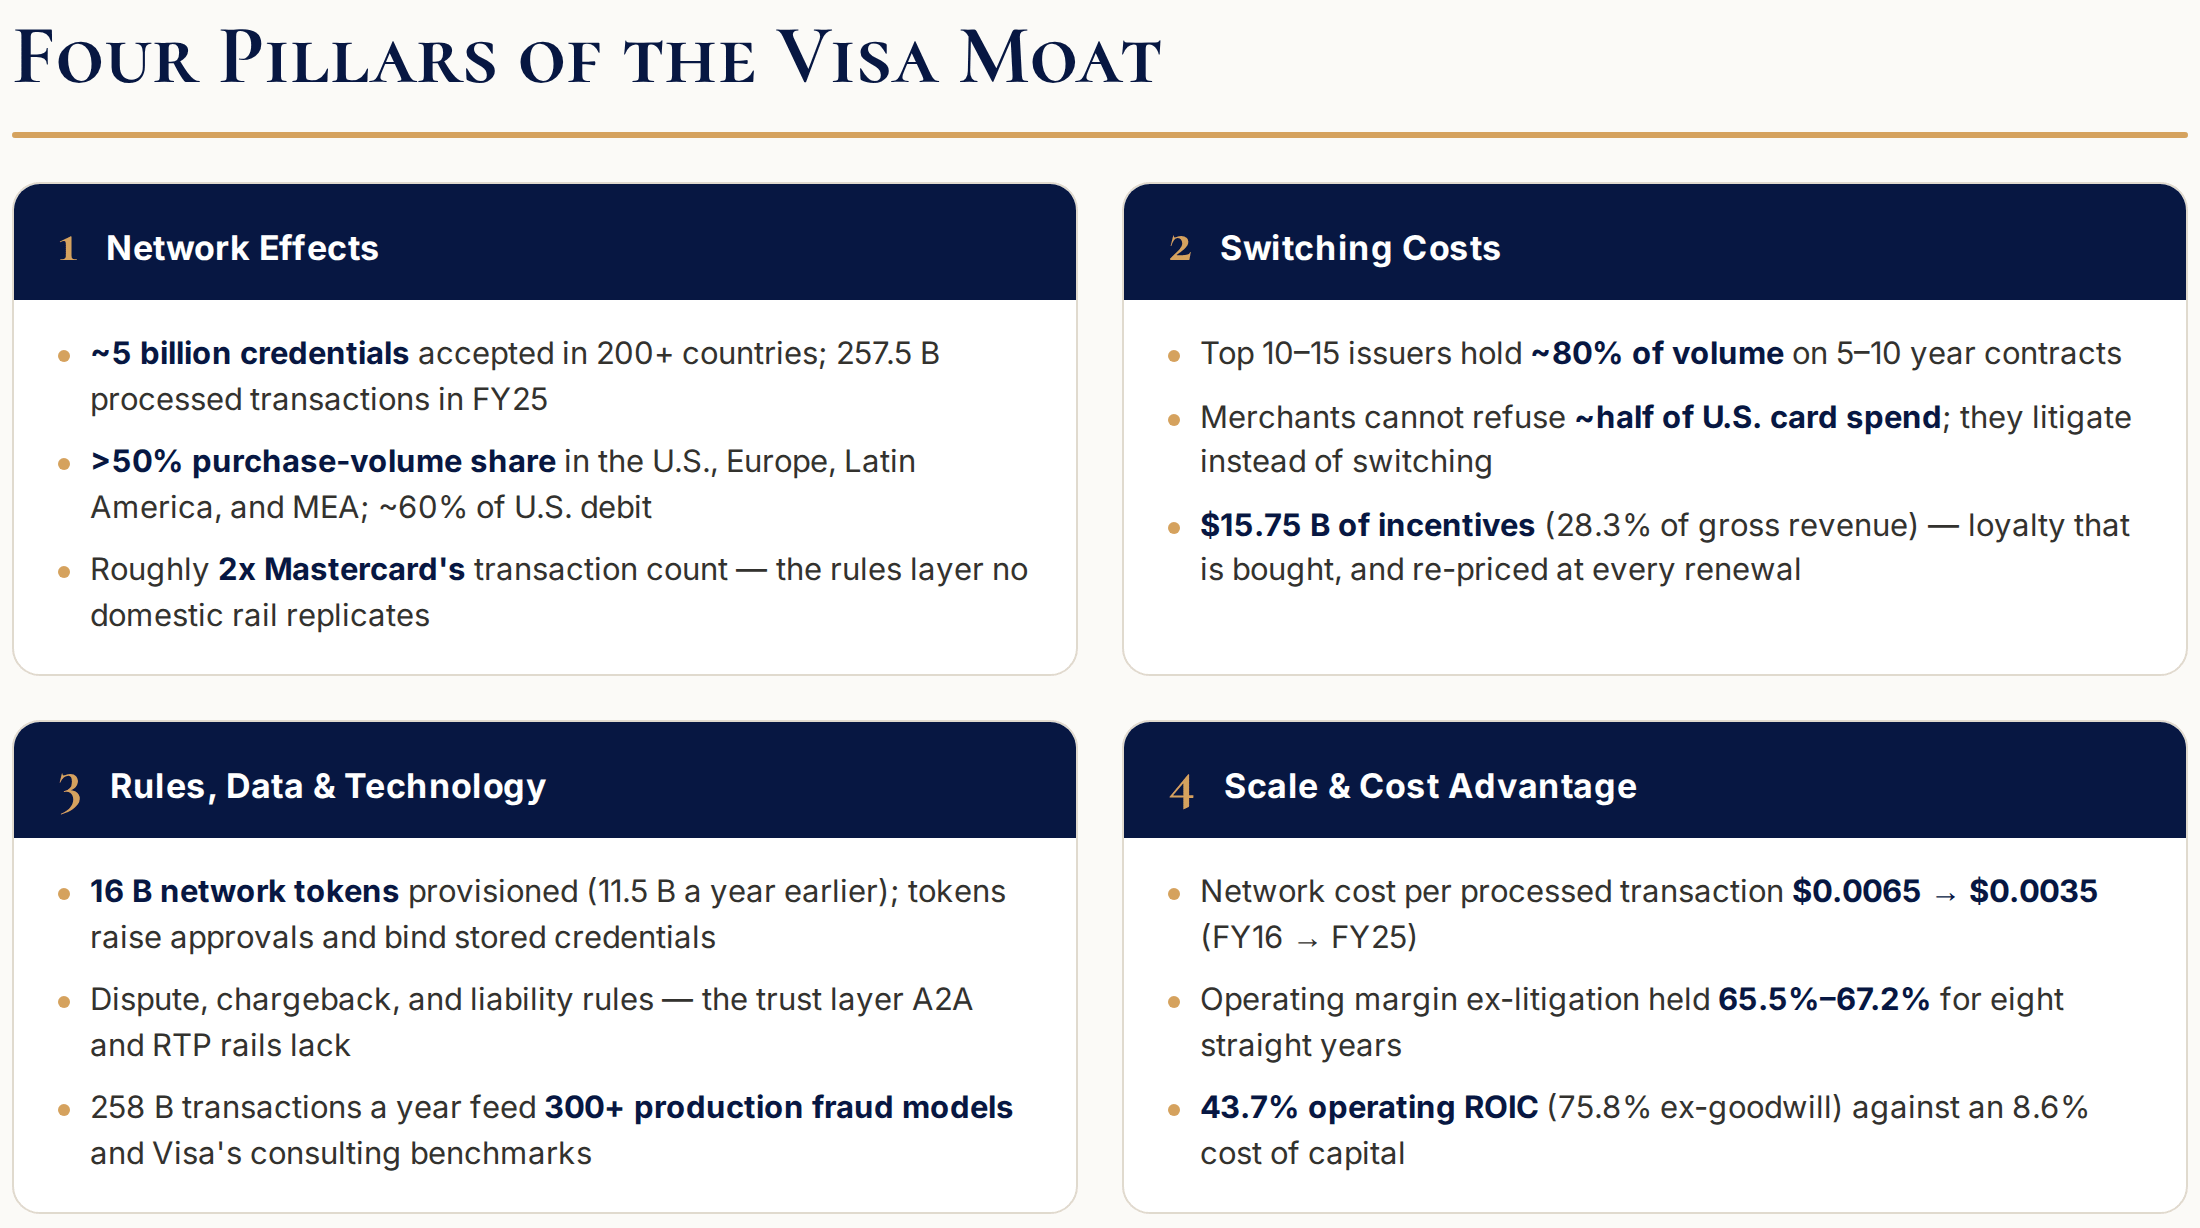
Visa processes roughly twice as many transactions as Mastercard. It holds more than 50% of purchase volume in the U.S., Europe, Latin America, and the Middle East and Africa. In U.S. debit, the Justice Department’s complaint puts Visa’s share at about 60%.
The network also produces economies of scale. Network and processing expense per transaction fell from about $0.0065 in FY2016 to $0.0035 in FY2025. Over the same period, that expense declined from 3.6% of net revenue to 2.2%. Excluding litigation, operating margin has stayed between 65.5% and 67.2%.
Switching costs
For merchants, leaving Visa is expensive. About 60–65% of U.S. consumer spending goes on credit or debit cards. Leaving means refusing roughly half of U.S. card spend and 30–33% of all U.S. consumer spending. No merchant wants to give up that revenue, which is why merchants fight Visa in court and at the Capitol instead of at the register.
Issuers can leave for another network, and occasionally do.
But Visa keeps the overwhelming majority with incentives: $15.75 billion in FY2025, growing faster than gross revenue in most years. Of every incremental dollar of gross revenue Visa earned from FY2021 to FY2025, about 32 cents went back to clients.
Moat: Wide. Multisided network of cardholders, merchants, issuing banks, and merchant banks. The main threat today is political, not competitive: regulation could reprice the network rather than replace it.
2. Dividend History
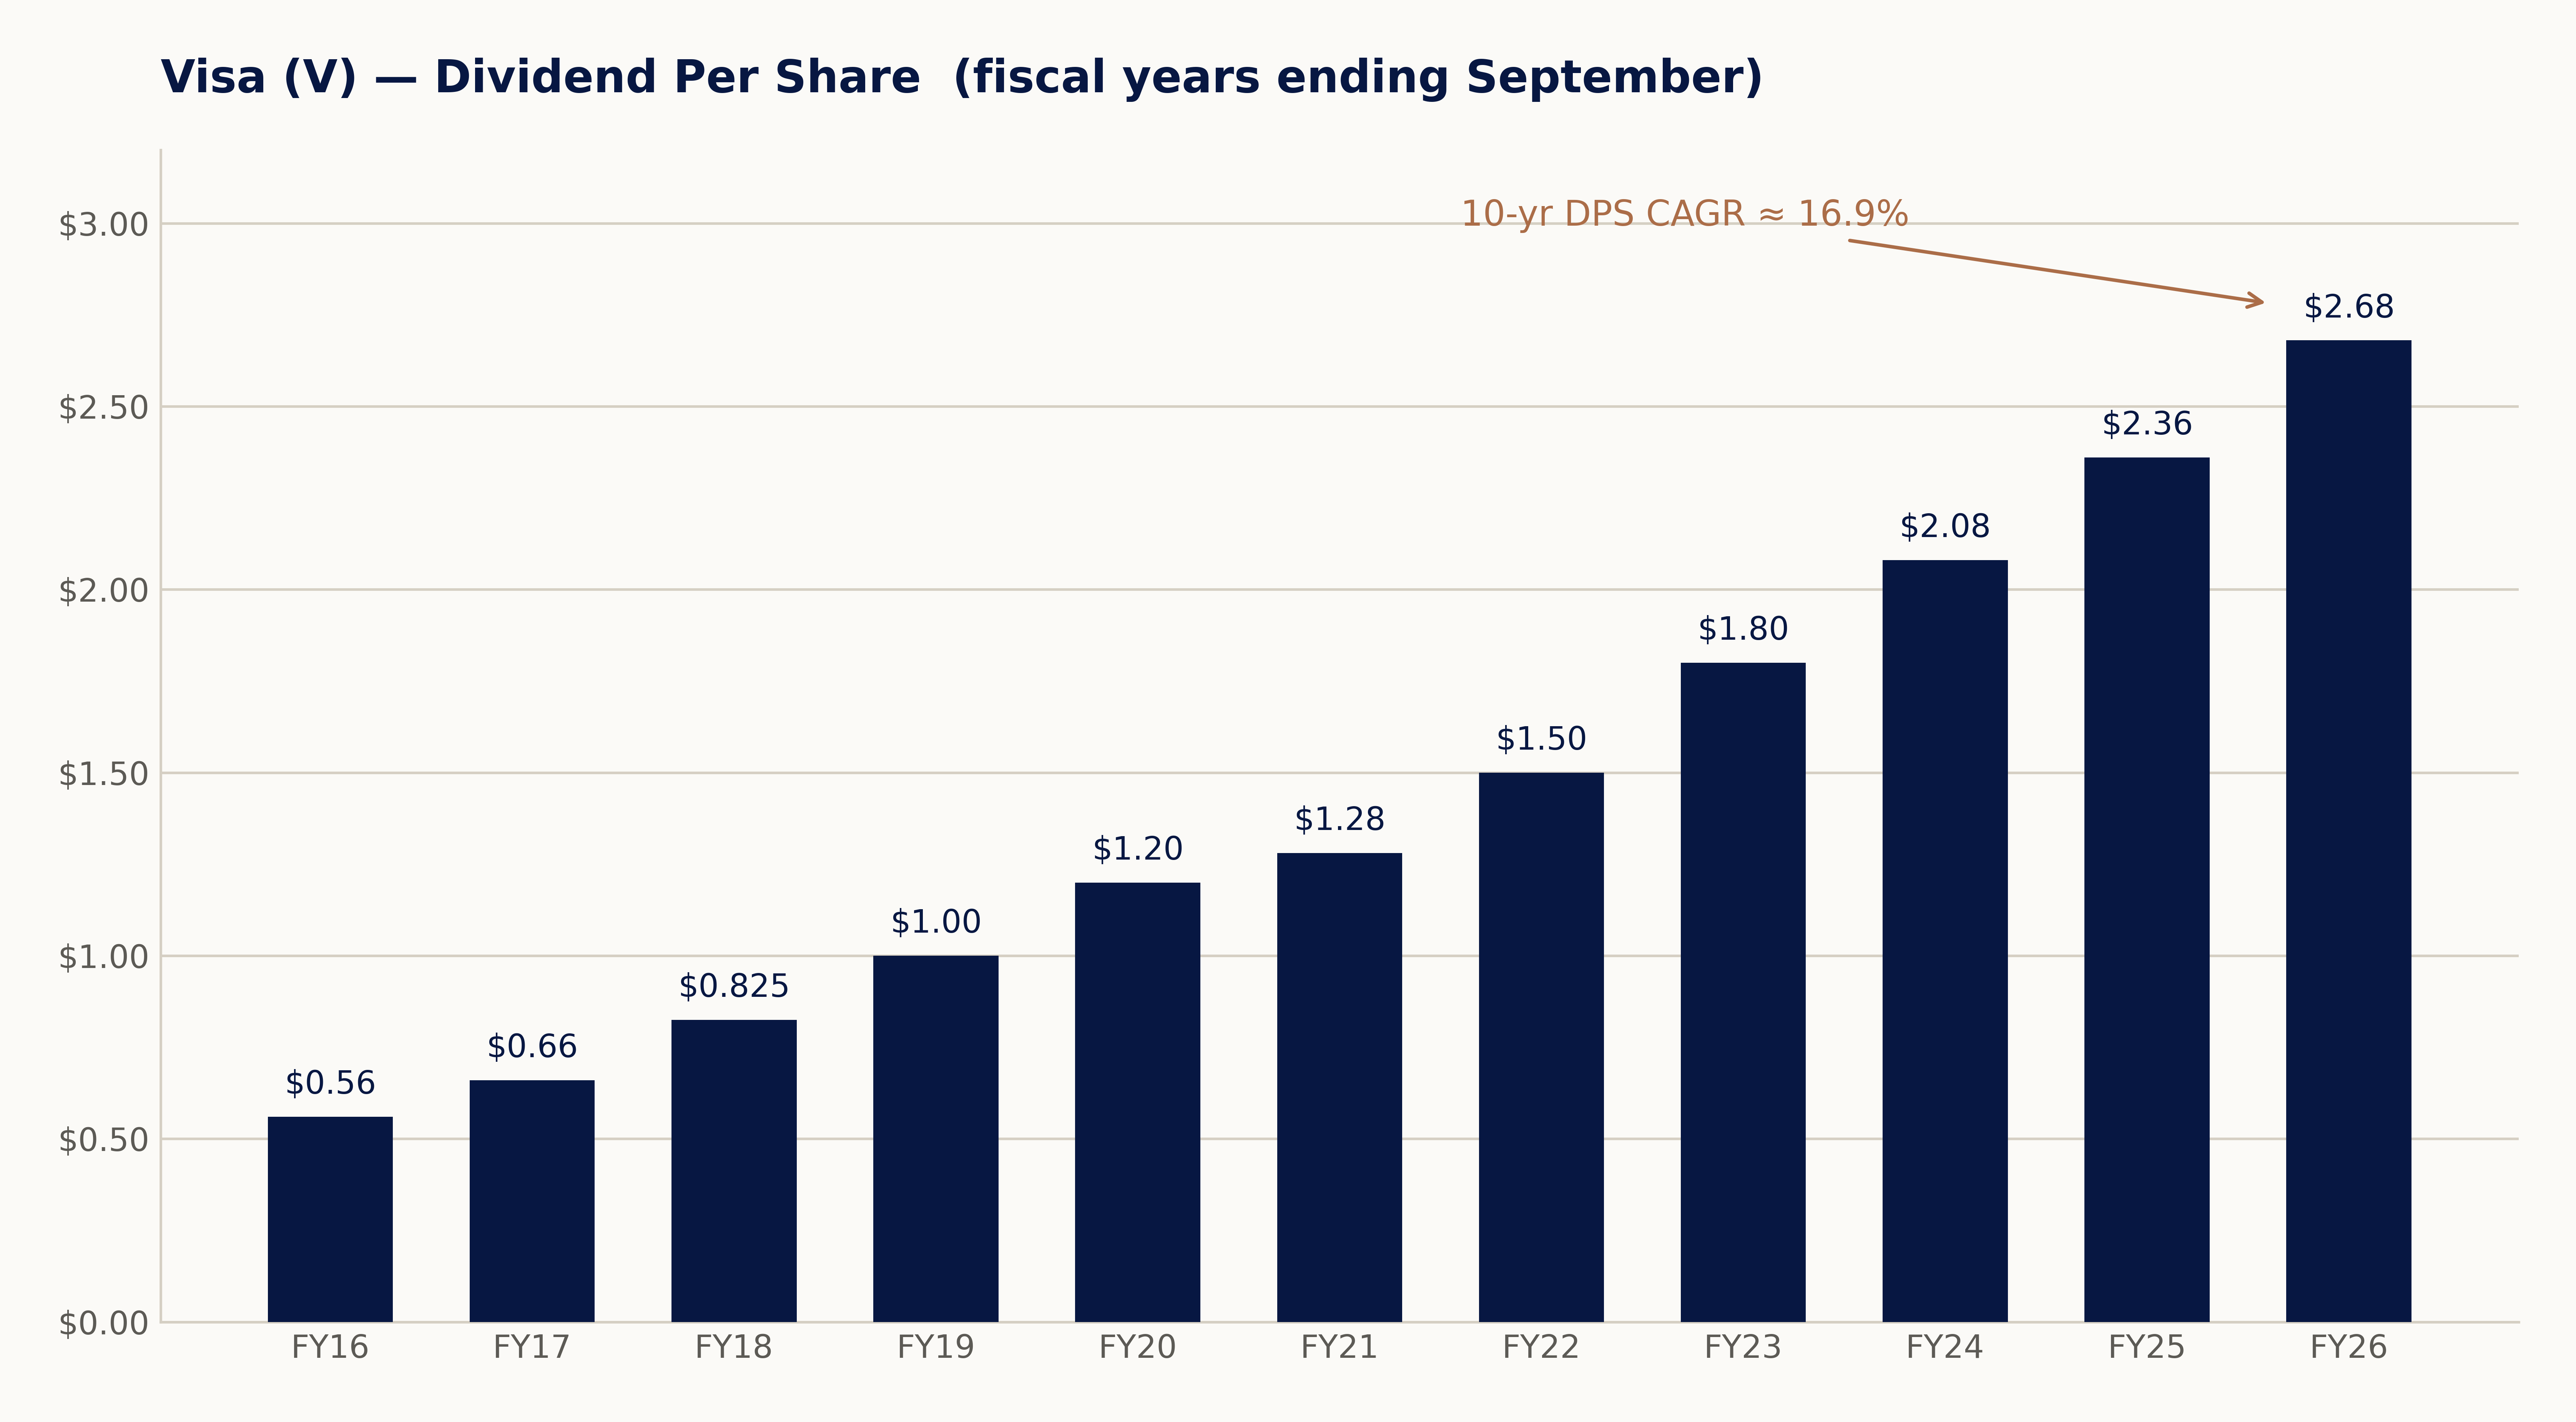
Visa has raised its dividend every year since the 2008 IPO. Seventeen consecutive increases make it a Dividend Challenger, a long way from Aristocrat status and further still from King. But what it lacks in history it makes up for in growth.
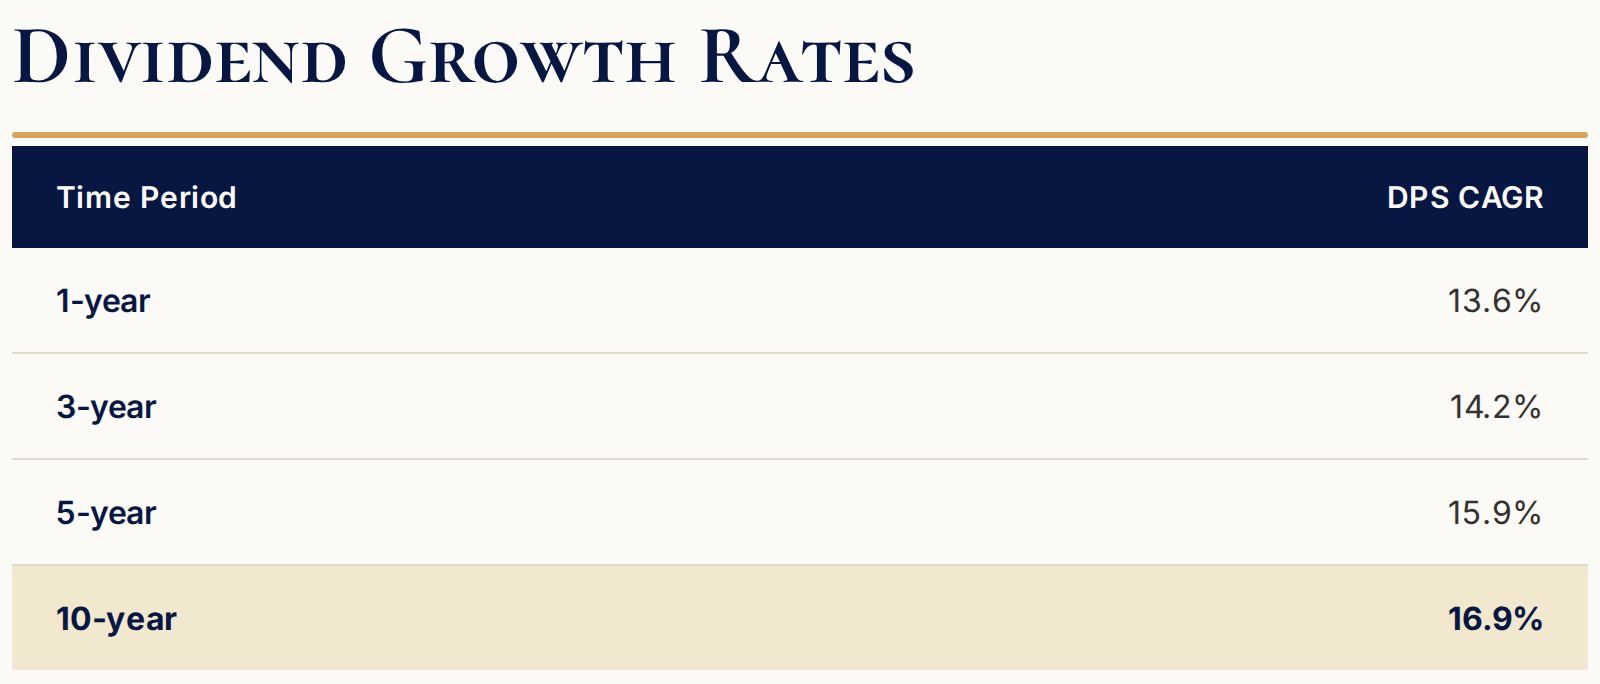
The largest single-year increase was 25.0% in FY2018, when the 2017 tax cut dropped through.
There has never been a cut or a freeze.
The consistency check
Over five years, the dividend compounded at 15.9% while free cash flow per share compounded at 10.6% ($6.64 in FY2021 to about $11.00 trailing). A dividend growing faster than the cash that funds it is usually a warning.
But Visa’s FCF payout ratio went from 19.3% to 23.8% over the same period. It is expanding from such a low base that another decade at the same pace would still leave the payout under 40%.
3. FCF Coverage & Balance Sheet
For the trailing twelve months through June 2026, Visa generated $21.0 billion in free cash flow, or $11.00 per share. It paid $5.0 billion in dividends, repurchased $21.2 billion in shares net of issuance, and recorded $0.92 billion in stock-based compensation.
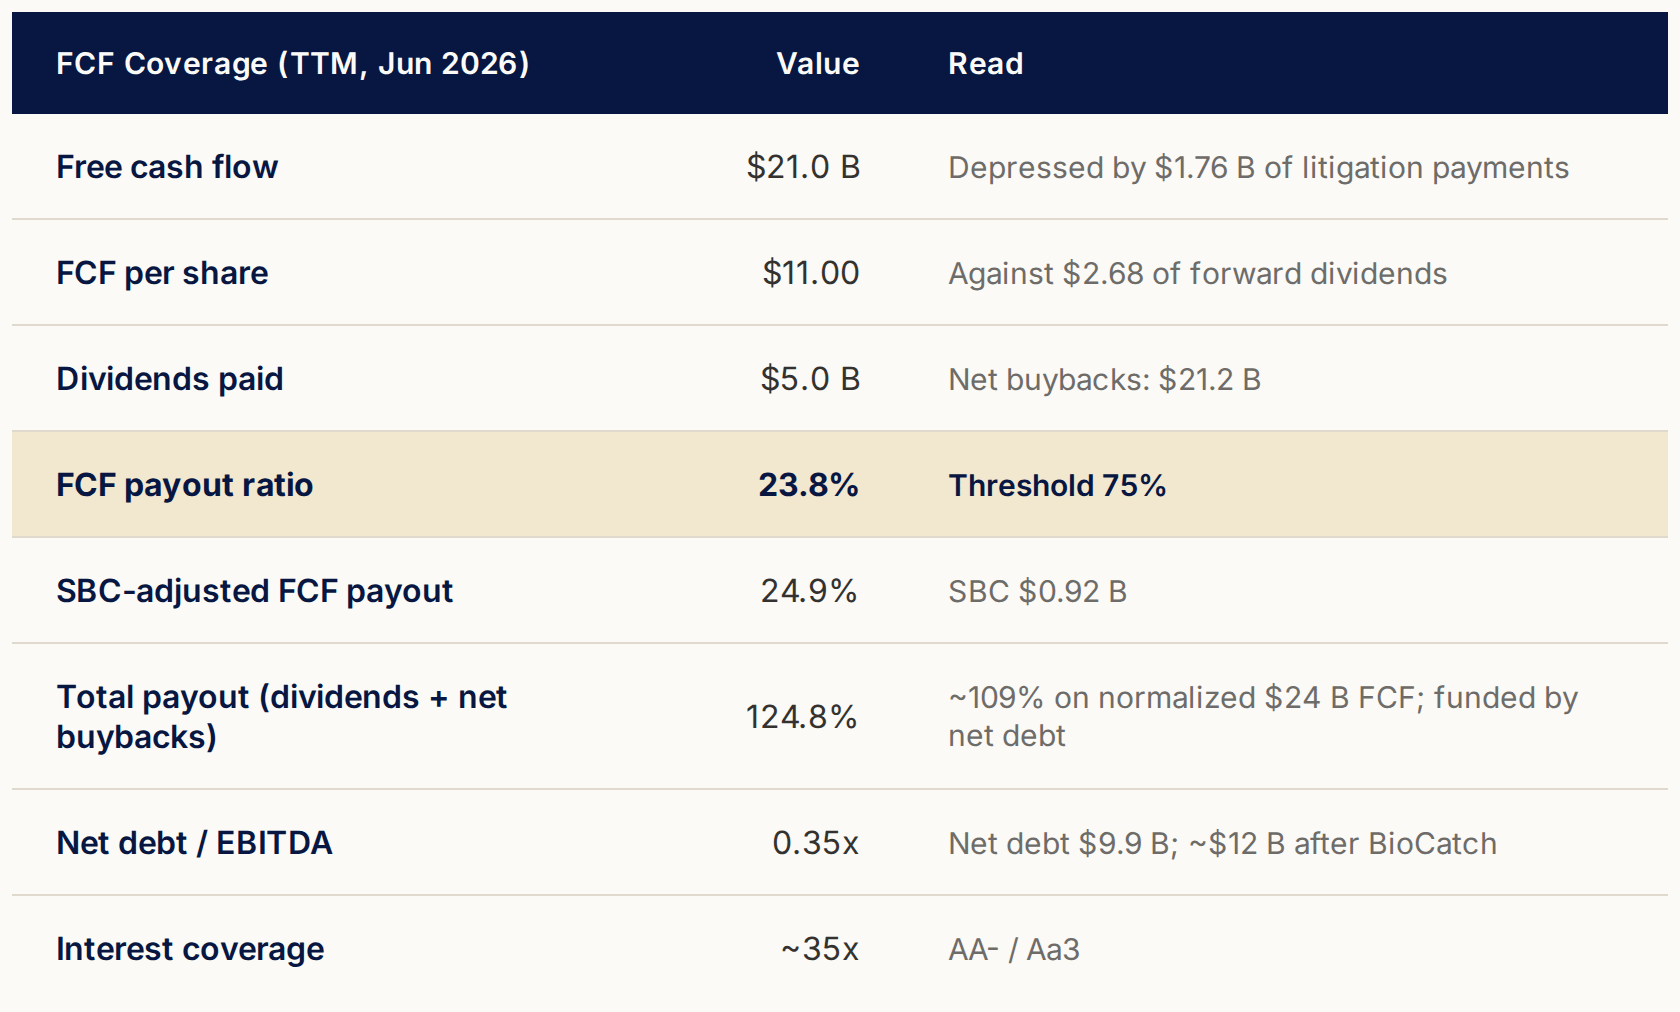
The total payout exceeds 100% partly because litigation payments of $1.76 billion depress trailing FCF. Normalized FCF is closer to $24 billion, putting the total payout at about 109%. Visa still returned more than it generated, and net debt rose from $5.2 billion to $9.9 billion to fund recent buybacks. The dividend alone remains covered more than four times.
Balance sheet
Total debt is $23.9 billion against $13.9 billion in cash and investments, leaving net debt of $9.9 billion. Net debt is 0.35x trailing EBITDA, and interest coverage is about 35x. Credit ratings are AA- and Aa3.
Debt maturities are staggered. About $2.75 billion of notes and $1.5 billion of commercial paper come due in FY2027, followed by $1.5 billion, $2.1 billion, and $1.5 billion over the next three years. As low-cost 2020-vintage debt refinances at 4% to 4.7%, the weighted coupon will rise from about 2.8%.
The BioCatch acquisition will bring net debt to about $12 billion, still below 0.5x trailing EBITDA.
Dividend safety: Very Safe. A $5 billion dividend on $21 billion of depressed free cash flow, a third of a turn of leverage, and AA-rated paper. The dividend could triple tomorrow and still be covered.
4. ROIC / ROIIC
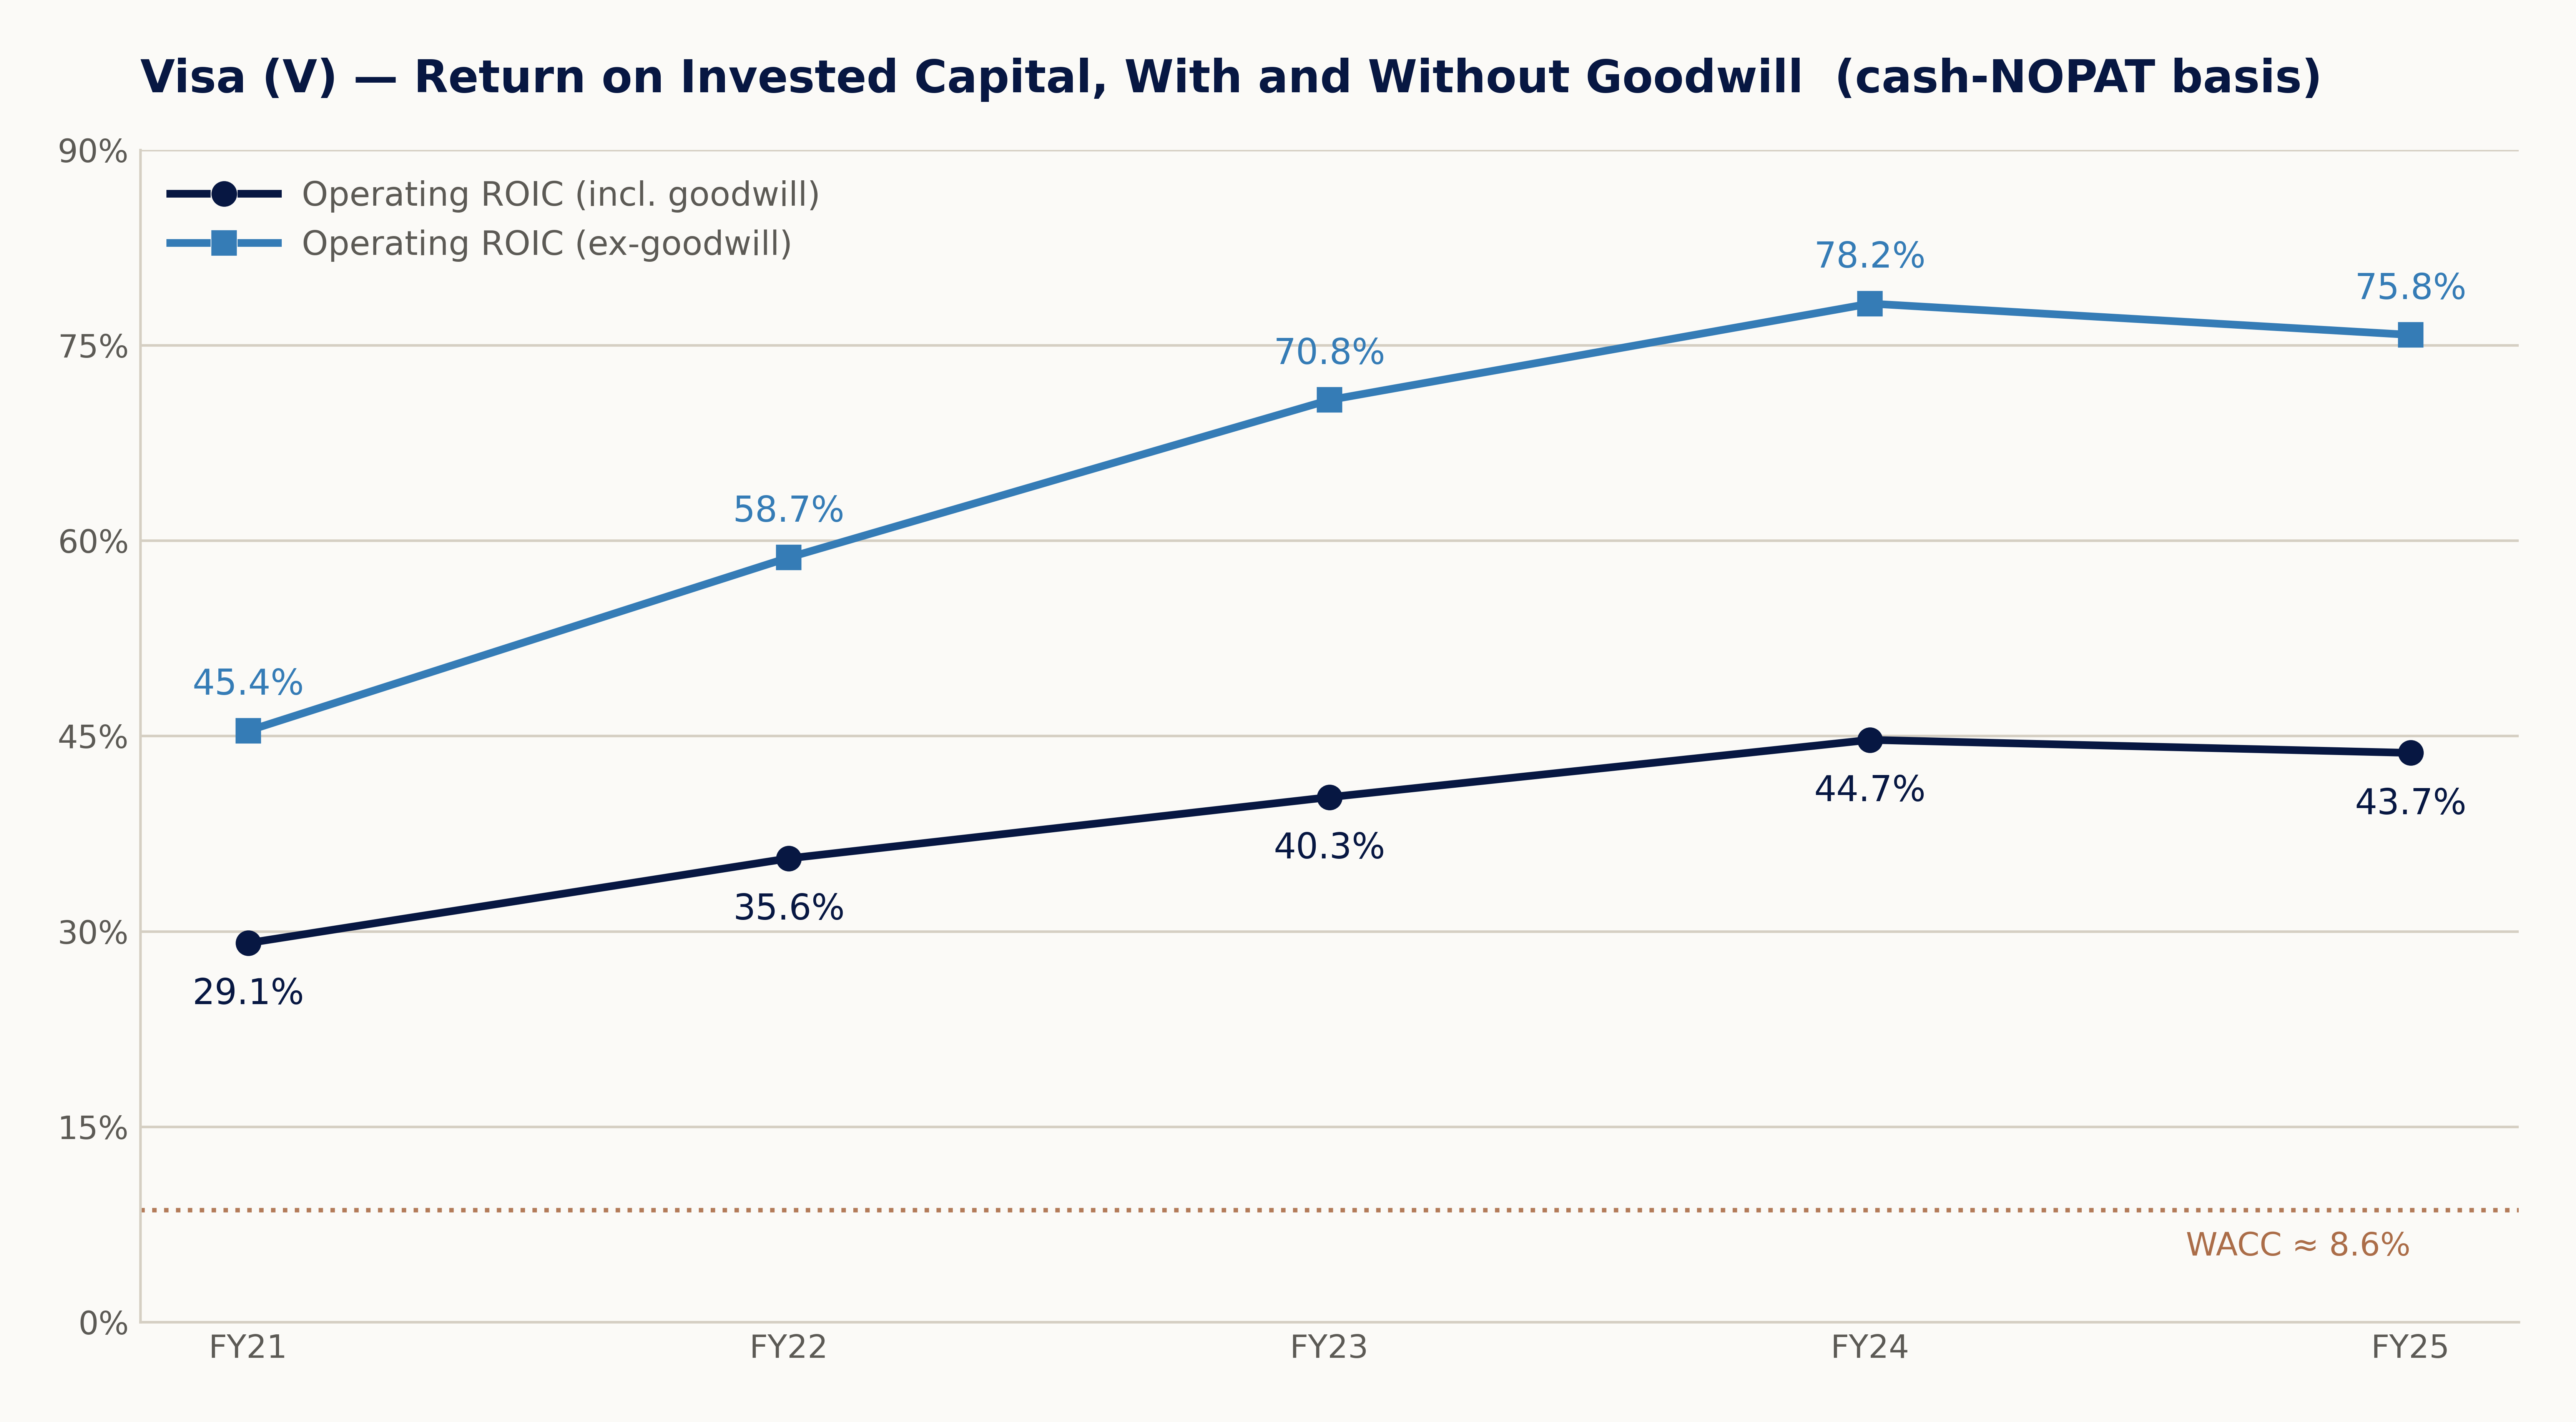
In FY2025, operating NOPAT was $20.0 billion on a cash-tax basis, against average invested capital of $45.8 billion, for a 43.7% ROIC. That is a 35-percentage-point spread over the 8.6% cost of capital, up from 20 points in FY2021. The widening spread is evidence that Visa’s moat is strengthening.
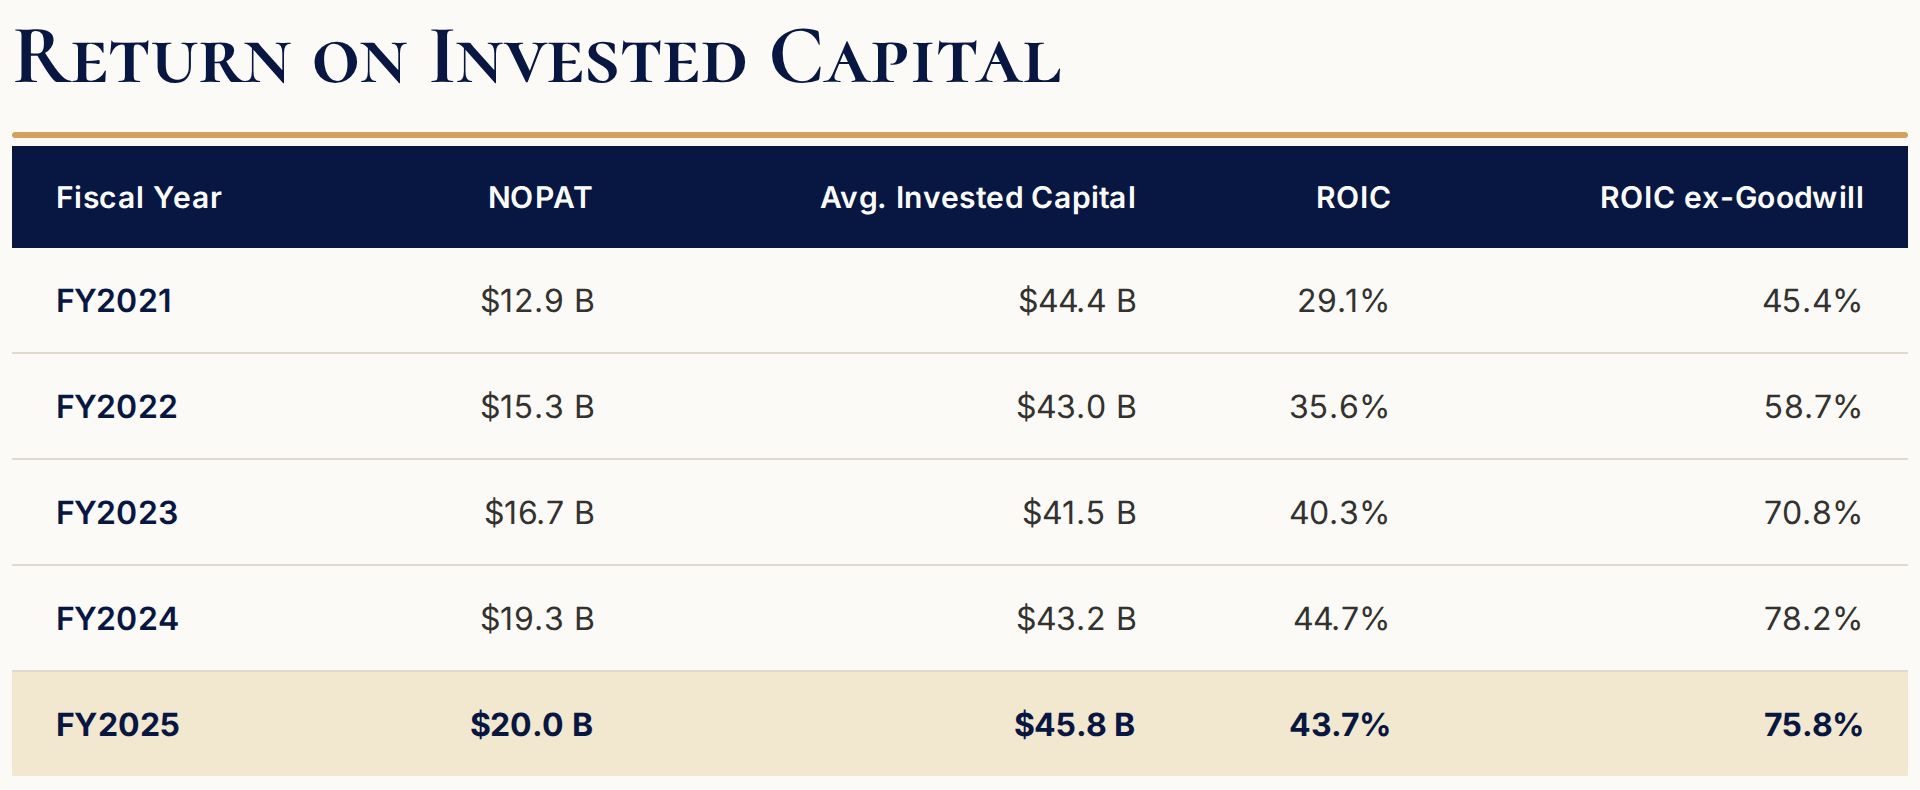
Average ROIC was 42.9% over three years, 38.7% over five, and 32.8% over nine (the full period since Visa Europe). Excluding goodwill, the figures were 74.9%, 65.8%, and 54.8%.
The FY2025 dip reflects a $2.6 billion litigation provision. Excluding it, ROIC was 45.9%.
The Goodwill Shadow
Of that $45.8 billion of invested capital, $19.9 billion is goodwill and $27.6 billion is acquired intangibles.
Almost all of it comes from two events.
In 2007 and 2008, the regional Visa associations merged ahead of the IPO, and in 2016 Visa bought Visa Europe for about $23 billion. Both transactions involved Visa buying back parts of its own franchise from the banks that owned them. The goodwill is the price of consolidation, and the network doesn’t need it to run.
Strip out the goodwill and intangibles, add back the litigation accrual, and about $2 billion of tangible capital remains.
If the question is “What did shareholders pay for the assets that produce these profits?” the right figure is 43.7%, the return on the full capital base. But if the question is “What does it cost Visa to add a dollar of profit?” the answer is close to nothing.
Incremental returns
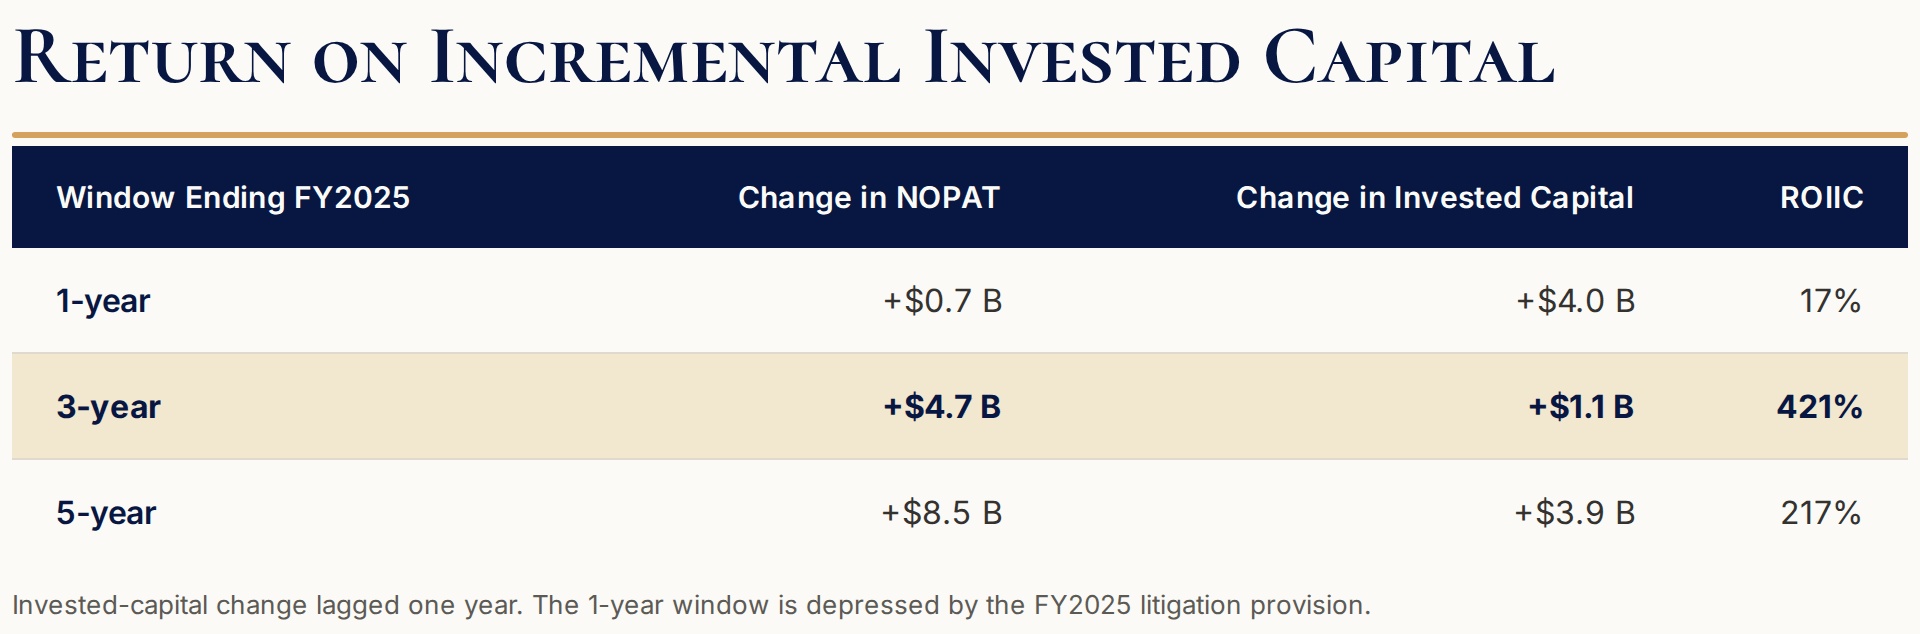
From FY2021 through FY2025, NOPAT grew 55%. Cumulative NOPAT was $84.3 billion. Visa returned $86.0 billion to shareholders: $67.4 billion through buybacks and $18.6 billion through dividends. That is 102% of cumulative NOPAT.
The reinvestment rate, measured as the change in invested capital relative to three years of NOPAT, was about 2%. Multiplied by the three-year ROIIC, that implies NOPAT growth of 8.4% a year, versus actual three-year growth of 9.4% a year.
Visa’s asset-light business model means it costs virtually nothing to add another dollar of profit.
5. Growth Catalysts
Short term
Sentiment
Visa’s FY2027 guidance arrives in late October. It will be the first full-year outlook since Visa cut about 2,600 roles in July 2026.
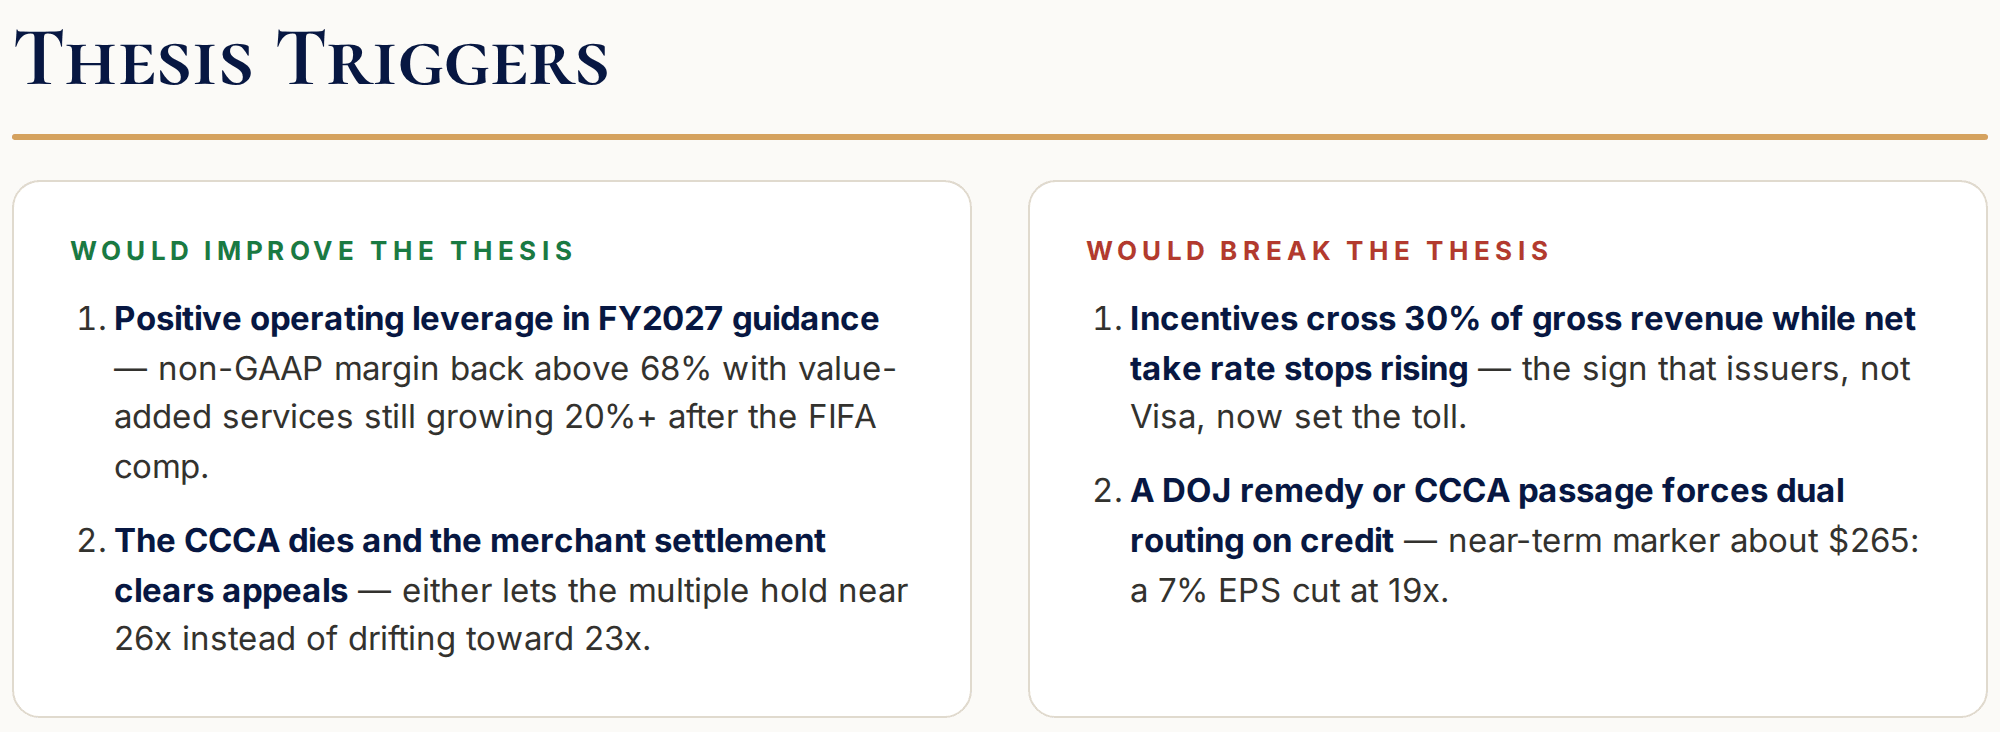
In the first nine months of FY2026, non-GAAP expenses grew 17%, versus revenue growth of 14%. A troubling trend for a scale business. Still, for Visa, this looks like a short-term blip, not a new long-term direction.
The merchant settlement is the other key event. Twenty-one years of litigation have produced special charges in seven of the past eight years, totaling $5.84 billion. Final approval would narrow the GAAP-to-adjusted gap, which was 12.5% in FY2025, even if appeals stretch toward 2029.
Long term
International Cash Displacement
The first long-term driver is the shift from cash to cards and other noncash payments in international markets. It is easy to overlook in the U.S., where most spending moved to cards and other noncash methods years ago.
Of $41 trillion in addressable consumer spending, $23 trillion still flows outside the global card networks. About $11 trillion remains in cash and checks. Nearly half of that $23 trillion is in Latin America, Asia Pacific, and CEMEA (Central and Eastern Europe, the Middle East, and Africa). The rest is in developed markets: $7 trillion in Europe and $5 trillion in North America. In Japan, more than half of consumer spending is still in cash.
Non-U.S. net revenue grew 15.2% in FY2025, compared with 5.8% in the U.S. Over five years, non-U.S. net revenue compounded at 17.2% a year, against 8.8% in the U.S.
International consumer debit, Visa’s cash-replacement product, grew 15.2% in the first nine months of FY2026. Cash withdrawals on Visa cards outside the U.S. totaled $1.48 trillion, 3.3 times the U.S. figure, and grew 5%.
With 61% of net revenue growing in the mid-teens, international markets contribute roughly 9 percentage points to total revenue growth.
Value-Added Services
The second driver is the services layer.
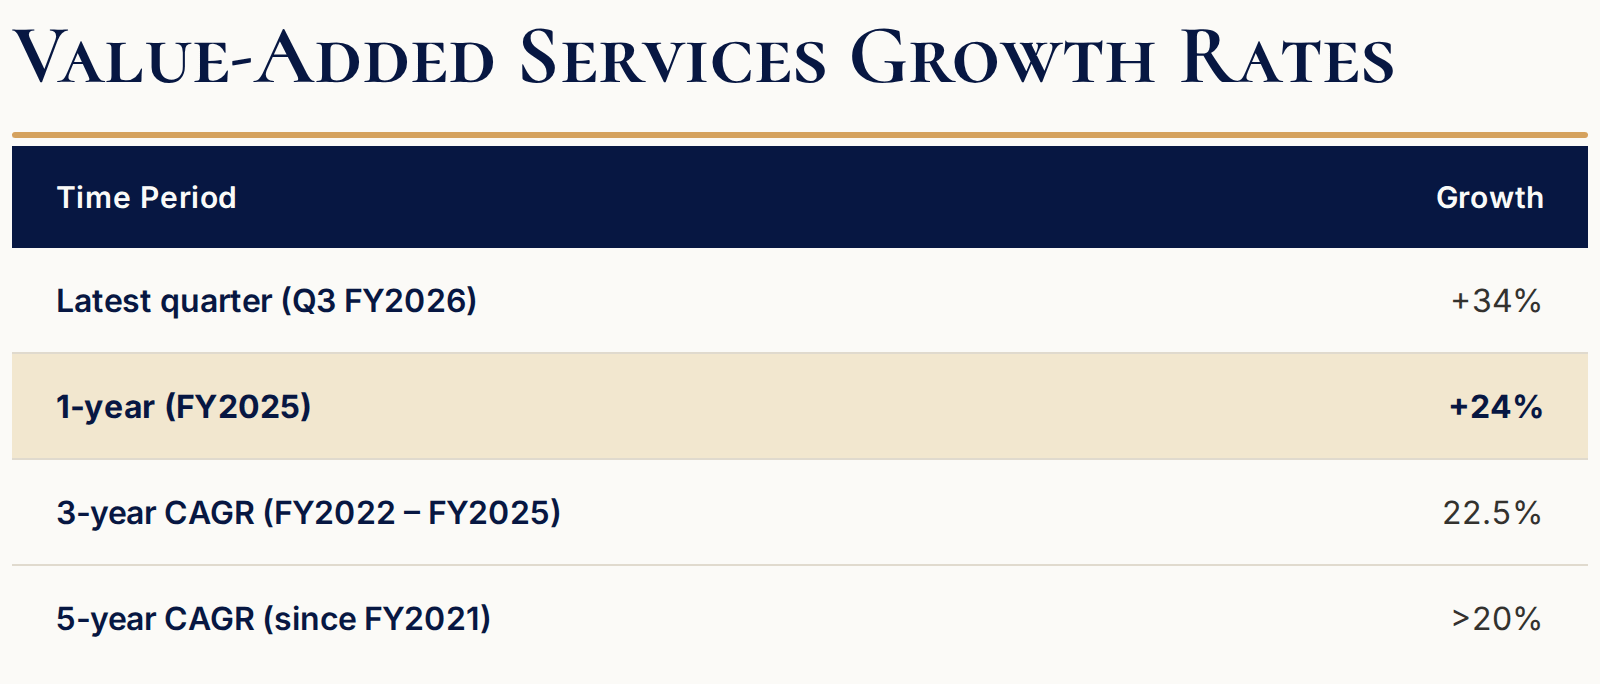
VAS accounted for about half of Visa’s net revenue growth. Strip VAS out and the core network grew 7.4% in FY2025.
Visa is a 7% toll road on global commerce with a software company growing 20%-plus a year bolted on. Agentic commerce, in which AI agents buy on a consumer’s behalf, needs more of these services attached to each transaction, which should push VAS growth higher in the coming years. VAS margins are estimated at 60% to 65%.
B2B
Commercial and money-movement flows are the third long-term driver. They include B2B payments, payouts, remittances, and Visa Direct, which grew 21% in the June quarter. This channel will likely take the longest to scale, and its potential may be smaller than management’s $145 trillion TAM suggests. Inertia is the problem: corporate treasurers remain attached to ACH bank transfers, even though Visa’s B2B business can improve liquidity, accelerate receivables, and reduce fraud.
6. Risks
Regulation
Merchants want access to consumer spending, but they object to the interchange fees they pay to reach those consumers. Rather than refusing the cards, merchant groups lobby lawmakers to target the payment networks.
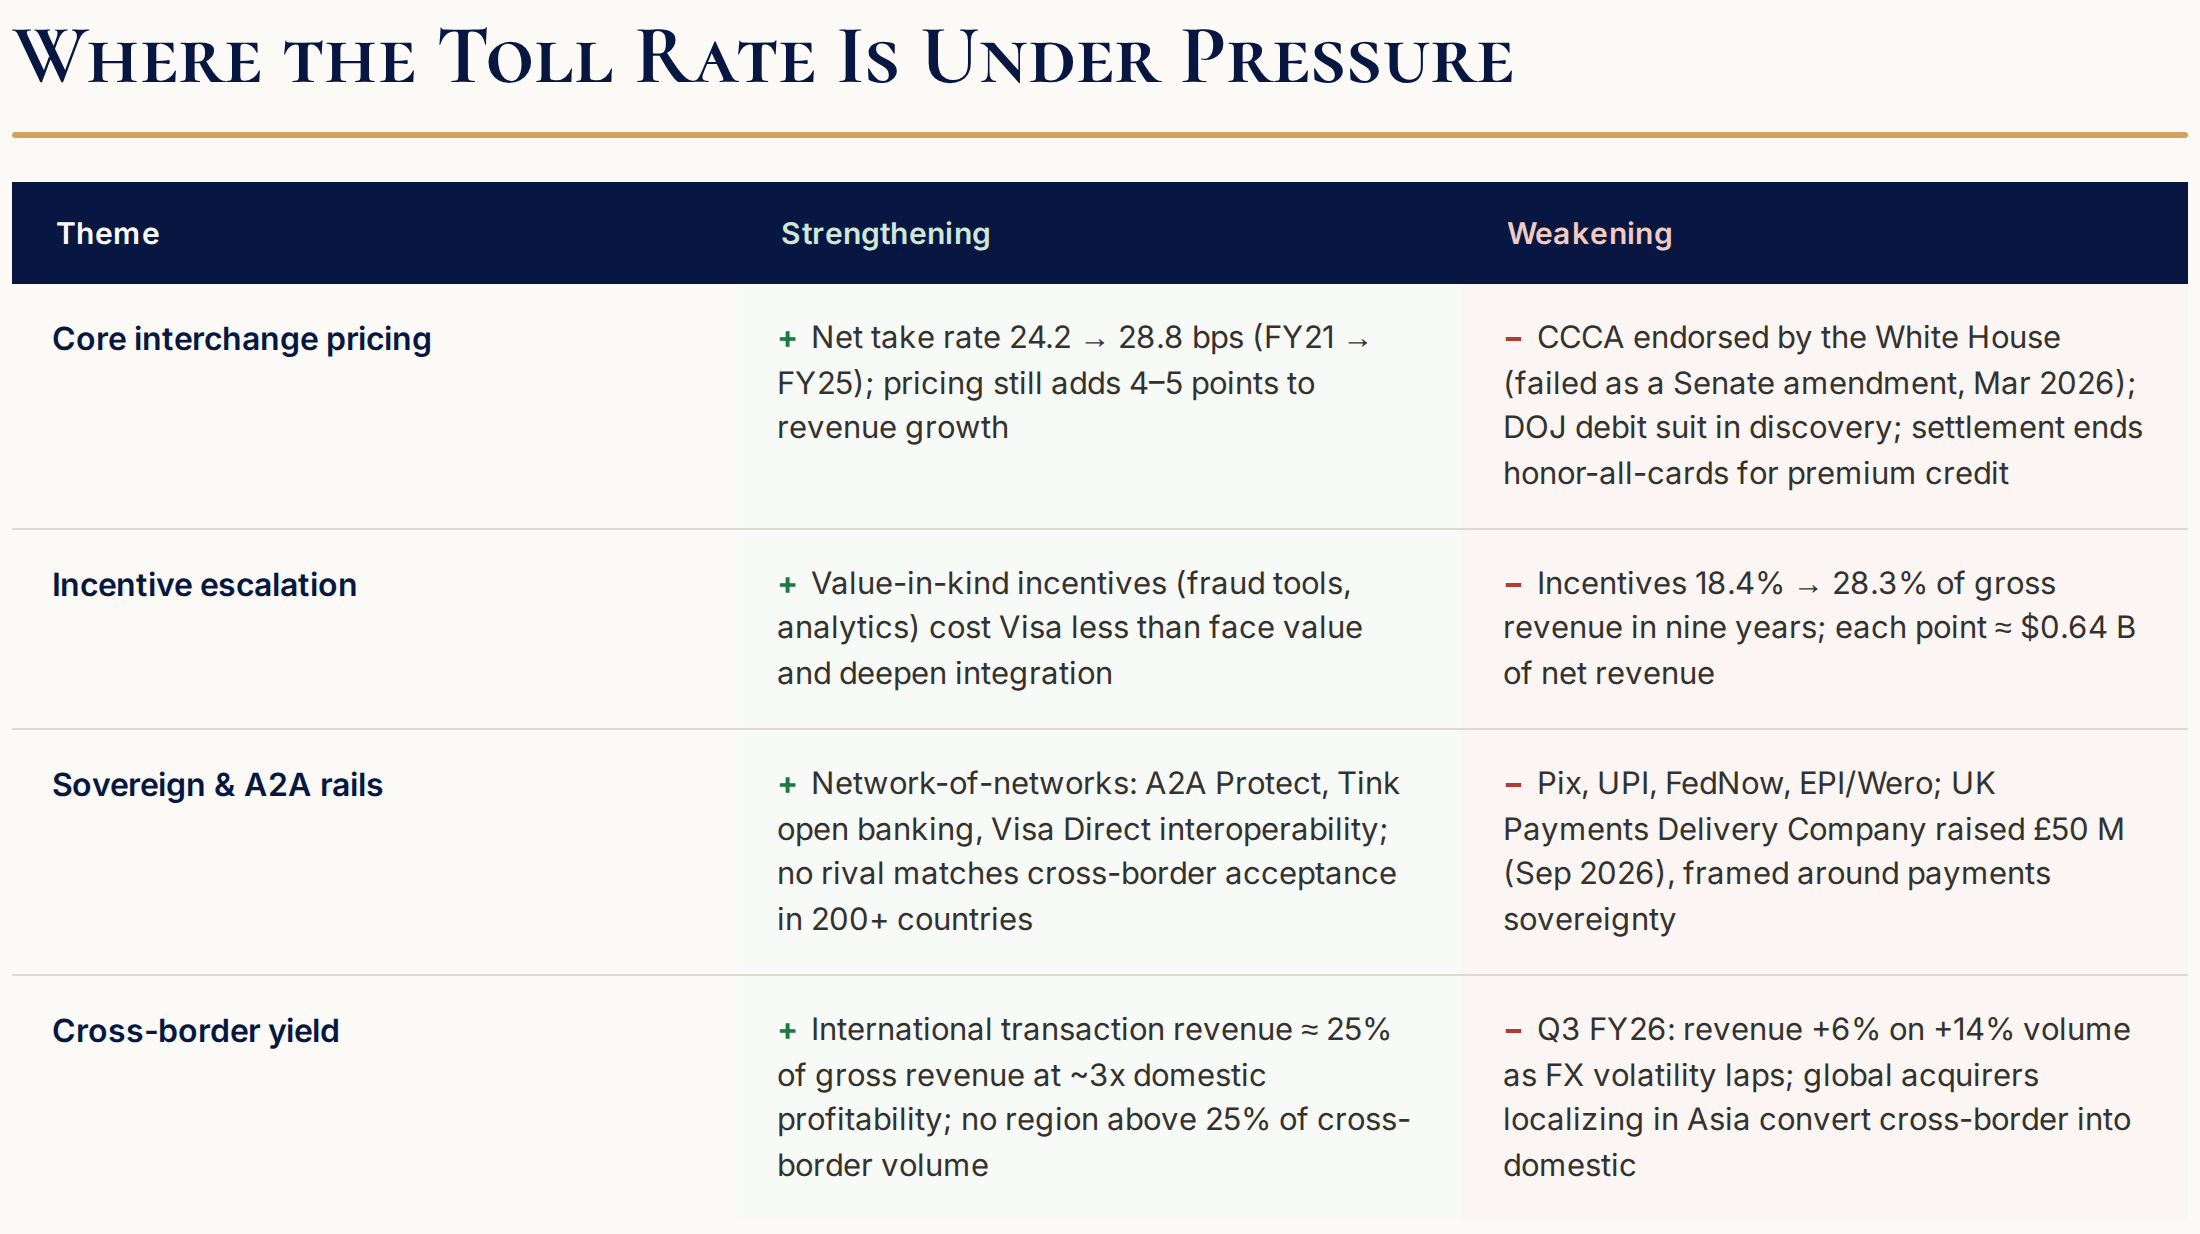
The key legislation is the Credit Card Competition Act (CCCA). It would require large issuers to enable a second network on credit cards and prohibit exclusive tokenization. The president has endorsed it, but it failed as a Senate amendment in March 2026. Its lead Democratic sponsor, Senator Dick Durbin, is retiring, and experts estimate the odds of passage at 10% to 25%.
If it passes, my rough estimate is a 4% to 6% drop in Visa’s net revenue and a 6% to 8% hit to EPS. The hit would be one-time.
Incentives
Incentives are cash or other rewards Visa pays to issuers, merchants, and other business partners to grow payment volume, increase acceptance, and encourage use of Visa’s network over competing networks. Visa books them as contra-revenue, a deduction from gross revenue. Over nine years, incentives rose from 18.4% to 28.3% of gross revenue. Each percentage point represents about $0.64 billion of net revenue on the FY2026 base.
The counterargument: losing market share and volume would cost far more than the basis point or two of margin Visa gives up by paying higher incentives.
7. Management & Capital Allocation
Ryan McInerney has been CEO since February 2023, after a decade as president; before Visa, he ran consumer banking at JPMorgan. Chris Suh, CFO since July 2023, came from Electronic Arts after 25 years at Microsoft. Steady operators. Guidance has been met or raised every quarter of their tenure.
Dividend
Visa has made no explicit dividend commitment and says it prefers buybacks to dividends. Still, management has raised the dividend for 17 years and is gradually letting the payout ratio rise. Given how little capital Visa needs to reinvest in growth, shareholders can reasonably ask for a higher payout.
Buybacks
Visa bought back $67.4 billion of stock from FY2021 to FY2025 and $16.4 billion more in the first nine months of FY2026, with $28.4 billion of authorization left. The buybacks are programmatic and price-insensitive.
M&A
Visa has made one transformational deal: Visa Europe in 2016, for about $23 billion. The rest are tuck-ins: Cybersource, Earthport, Currencycloud, Tink, Pismo, Featurespace, and Prisma.
Compensation
CEO compensation was $31.6 million in FY2025. Half of the long-term equity awards were performance shares, with a modifier tied to relative total shareholder return.
Two concerns stand out. The plan includes no capital-efficiency metric, such as ROIC or free cash flow per share. It also measures performance on adjusted EPS: $11.37 versus GAAP EPS of $10.20 in FY2025. As a result, $5.8 billion in cumulative litigation provisions have not affected the pay metric.
Insider Ownership
Insider ownership is small relative to Visa’s market capitalization but meaningful in dollar terms. That is typical for a company that was once the largest IPO in history and was previously owned by a consortium of banks.
Management earns a score of 7. The team has stewarded a business that largely runs itself, though its compensation design and buyback pricing could be sharper.
8. Peer Comparison
Mastercard is Visa’s only true comparable. They’re the same business. American Express is here for contrast: a closed-loop network operator that is also a lender.
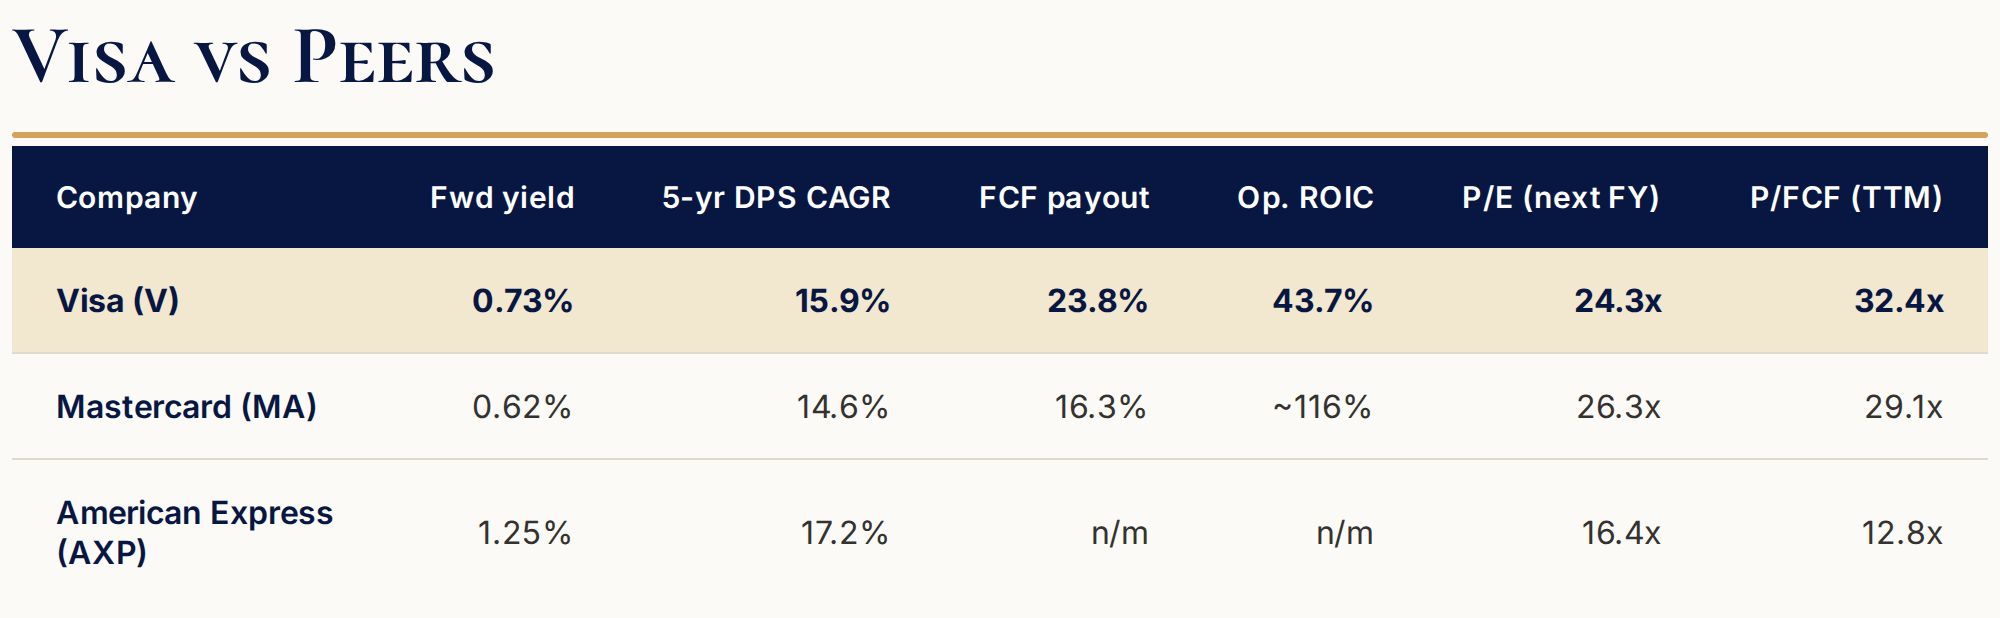
The Mastercard column is the interesting one. Mastercard grows a point or two faster on a thinner equity base, and its invested capital is about $13.5 billion against Visa’s $46 billion. The entire difference is Visa’s $47 billion of consolidation goodwill.
Visa trades two turns cheaper on forward earnings than Mastercard for a slower-growing but larger, more profitable, and more cash-generative version of the same business. I think that discount is about right, but both deserve premium multiples to the market.
9. Valuation
At $364.96, Visa’s market cap is about $681 billion and its enterprise value $691 billion.
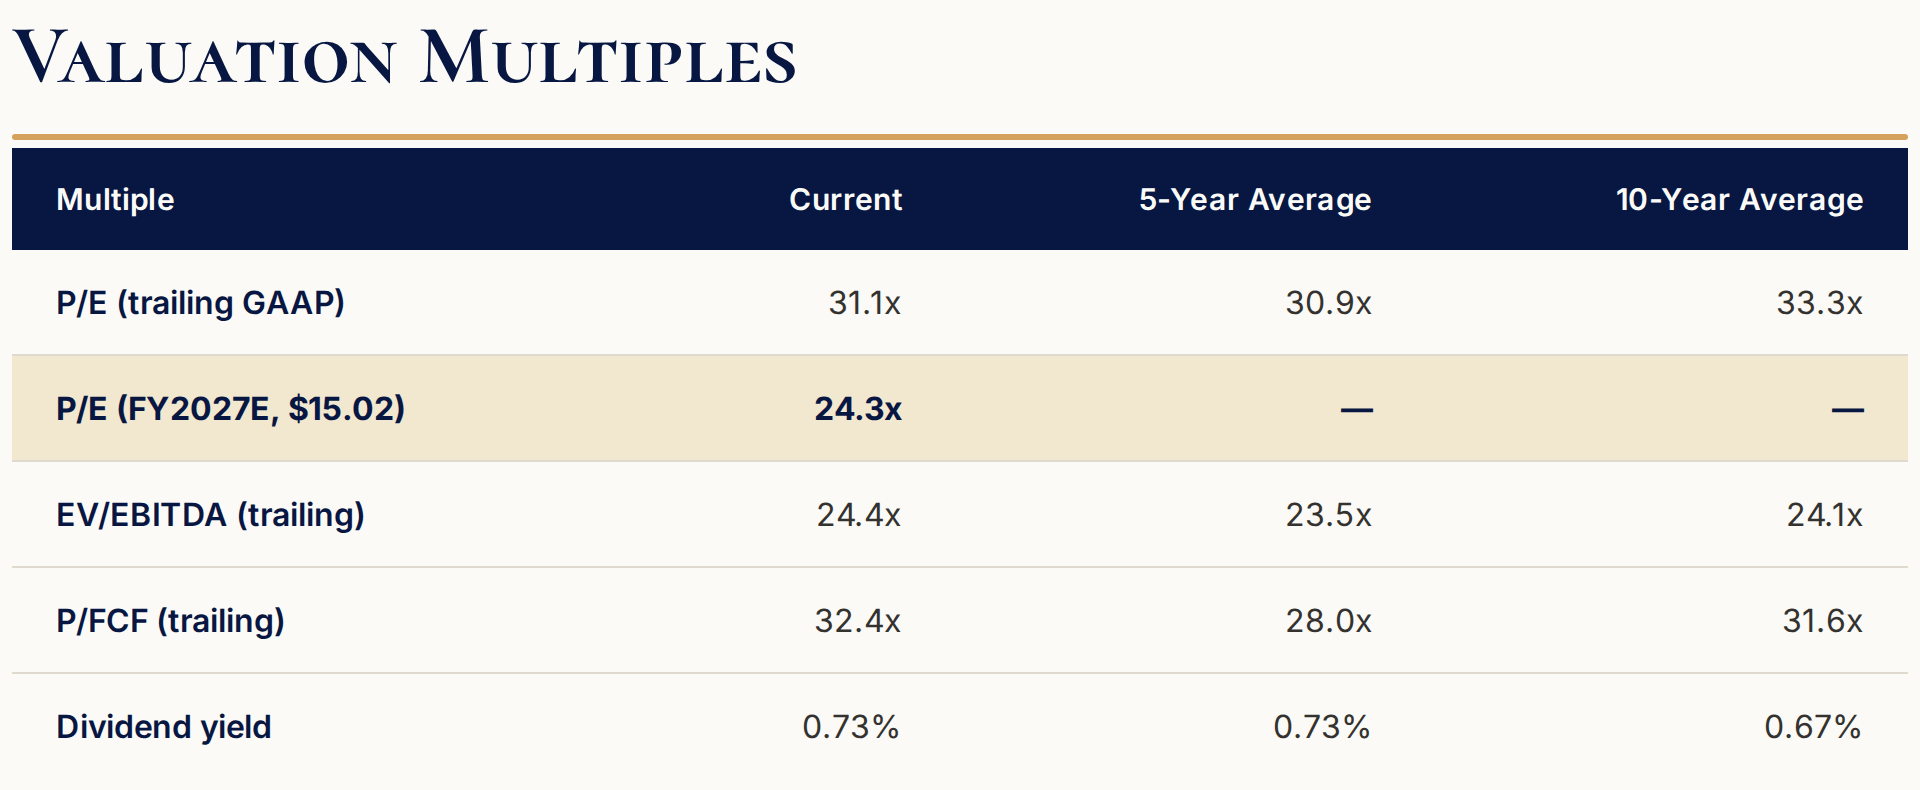
Every trailing multiple sits within a turn or two of its own history. The forward multiple, 24.3x, is at the low end of the five-year band because the earnings base has grown into the price. The yield is exactly its five-year average.
What The Price Assumes
With enterprise value of $691 billion, normalized free cash flow of $24.0 billion, an 8.6% discount rate, and 3% terminal growth after year ten, the current price implies 10.0% annual FCF growth for ten years. From the revenue side, it implies a 9.1% revenue CAGR at a 67.7% EBIT margin, or 10.5% at the 60% margin Visa reported in FY2025.
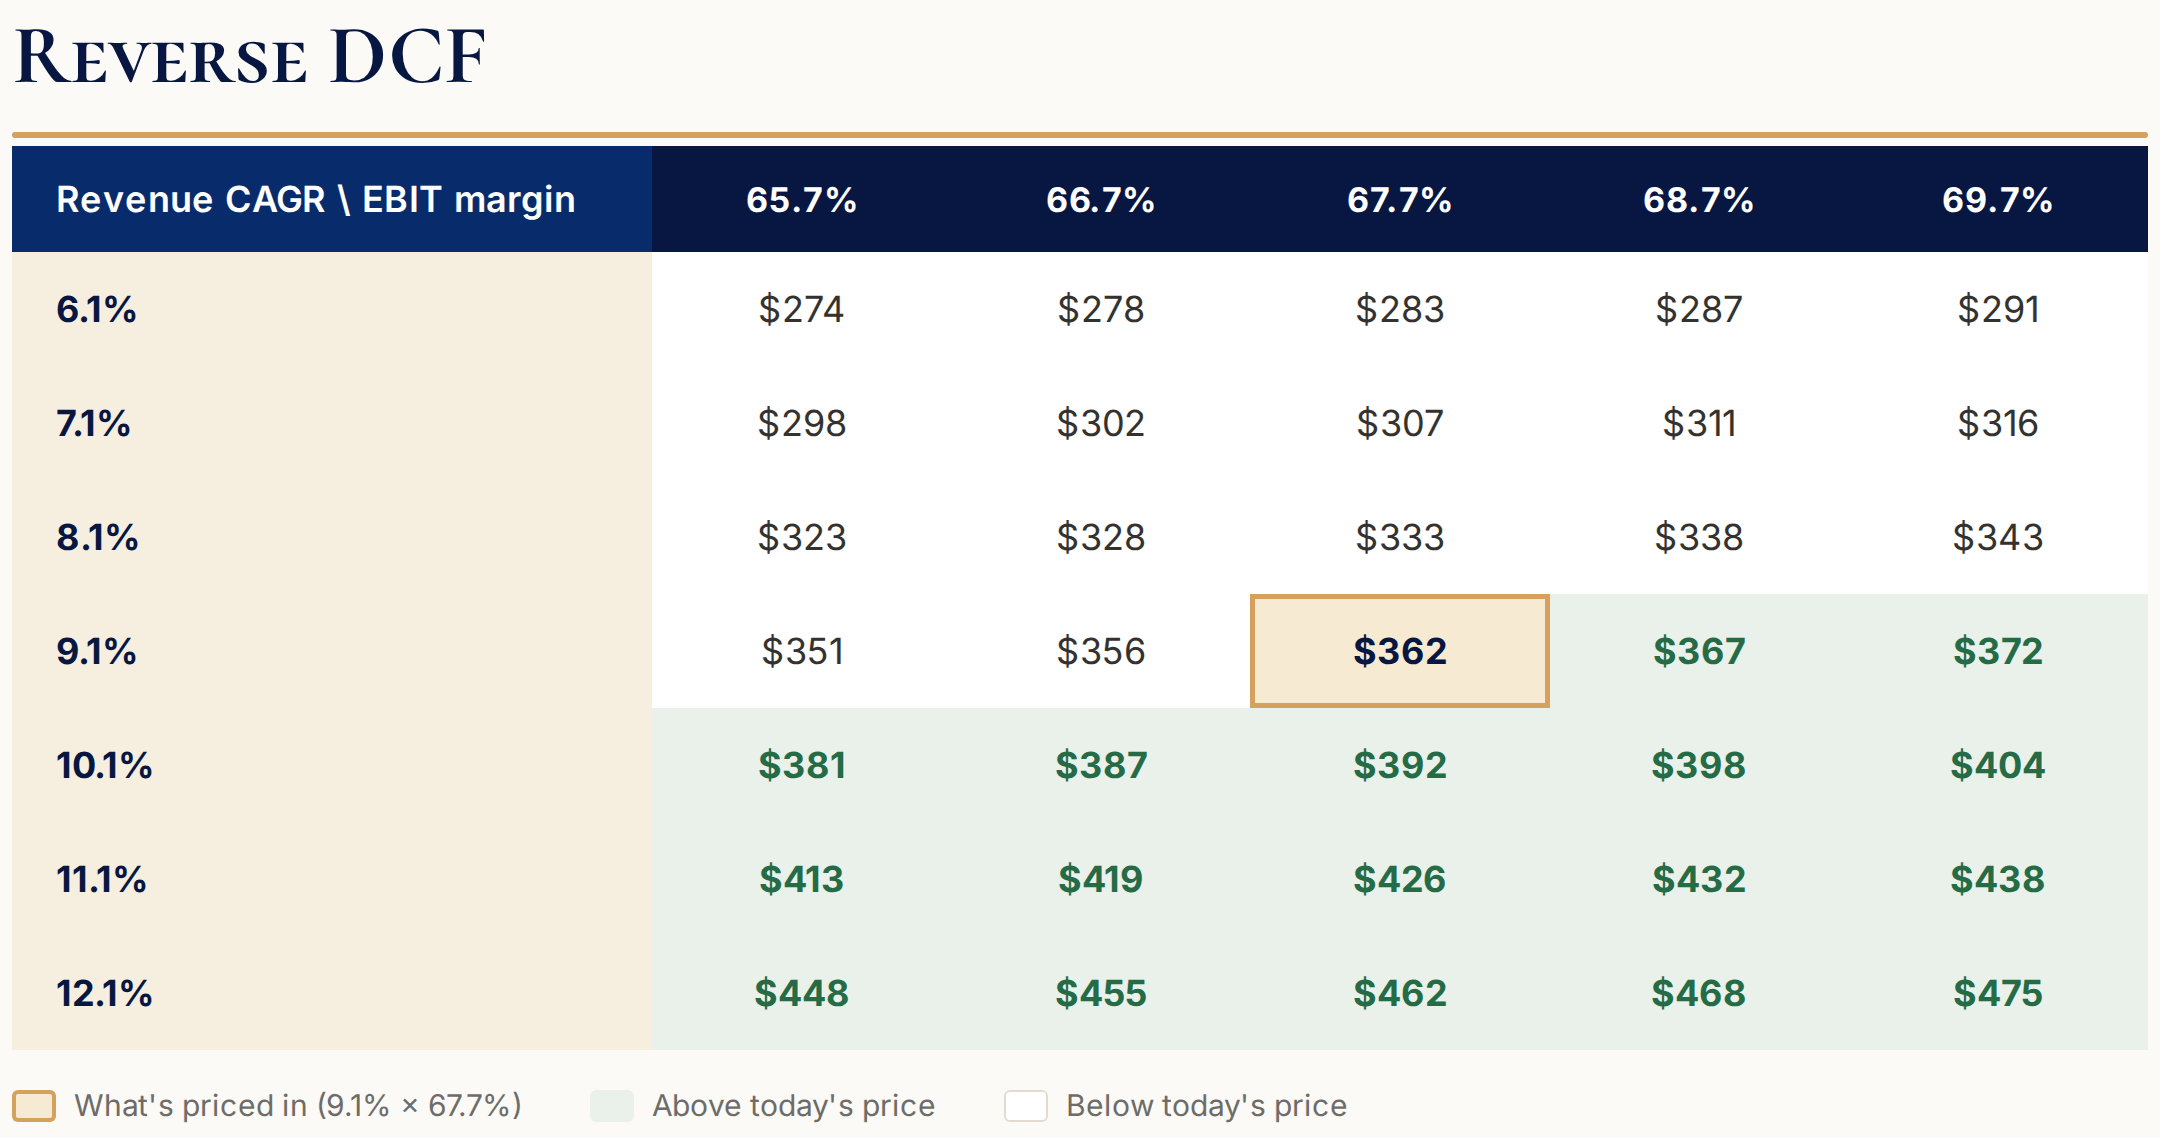
Free cash flow grew 10.3% a year from FY2019 to FY2025. NOPAT grew 11.8%. The market is pricing a replay of the last six years.
Fair value
My base-case DCF, with 8.6% growth and 3% terminal growth, prints $363.
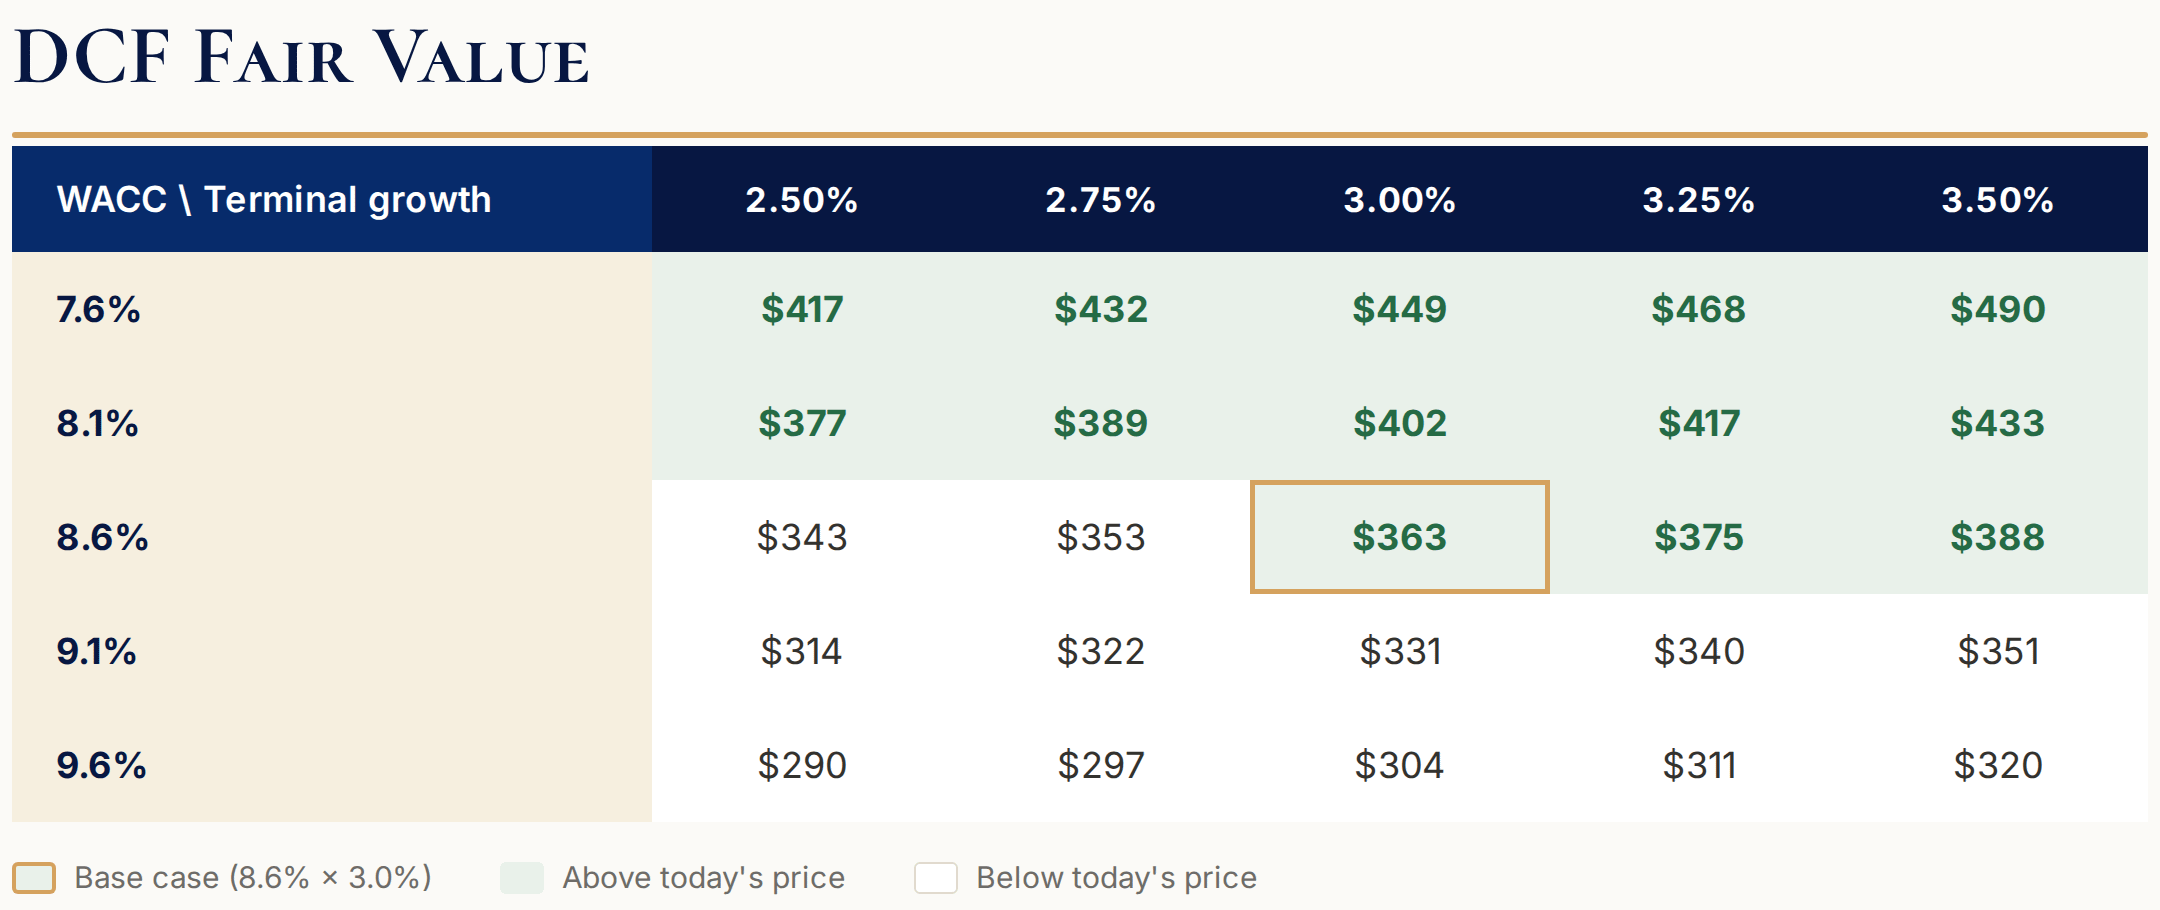
With a fair value from $320 to $390. The as I write this Visa is trading right around my base case estimate with no margin of safety.
If the price gets down to our below $320 a share than it is time to add to your position or start a new one.
10. The Verdict
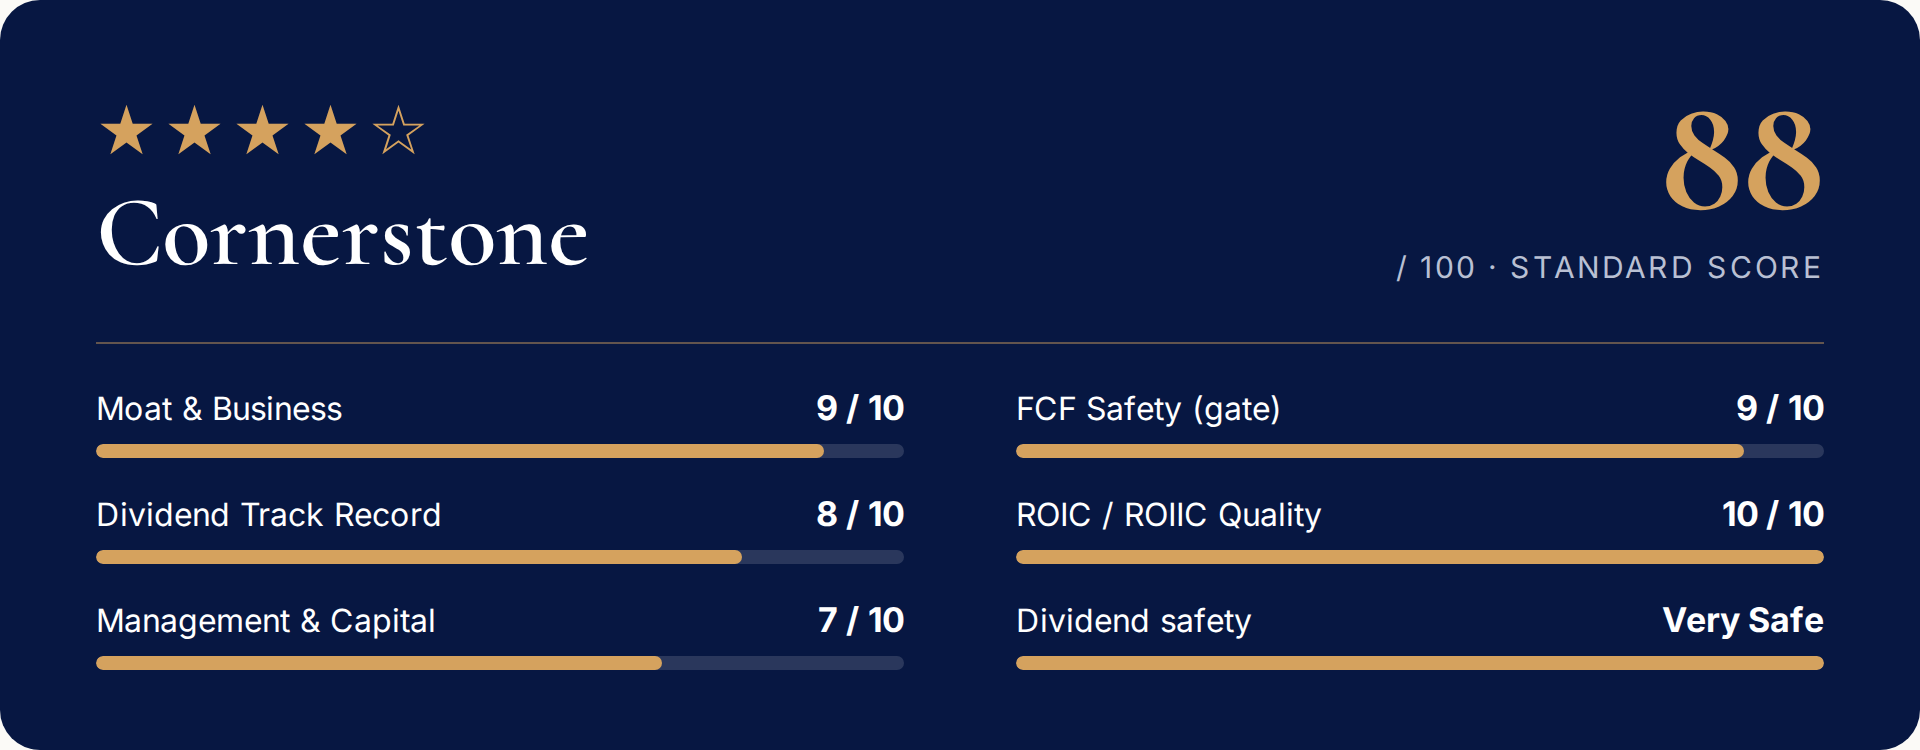
The moat loses a point because regulatory risk is real and political. Which is too much of a wild card these days. FCF safety loses a point because the total payout ratio exceeds 100%, with rising net debt helping fund shareholder returns. The rubric caps the track record: 17 years of increases earns Challenger status, despite the dividend’s rapid growth. ROIC earns the full 10 points. Management earns a 7 because of buyback pricing and compensation design, not weak stewardship.
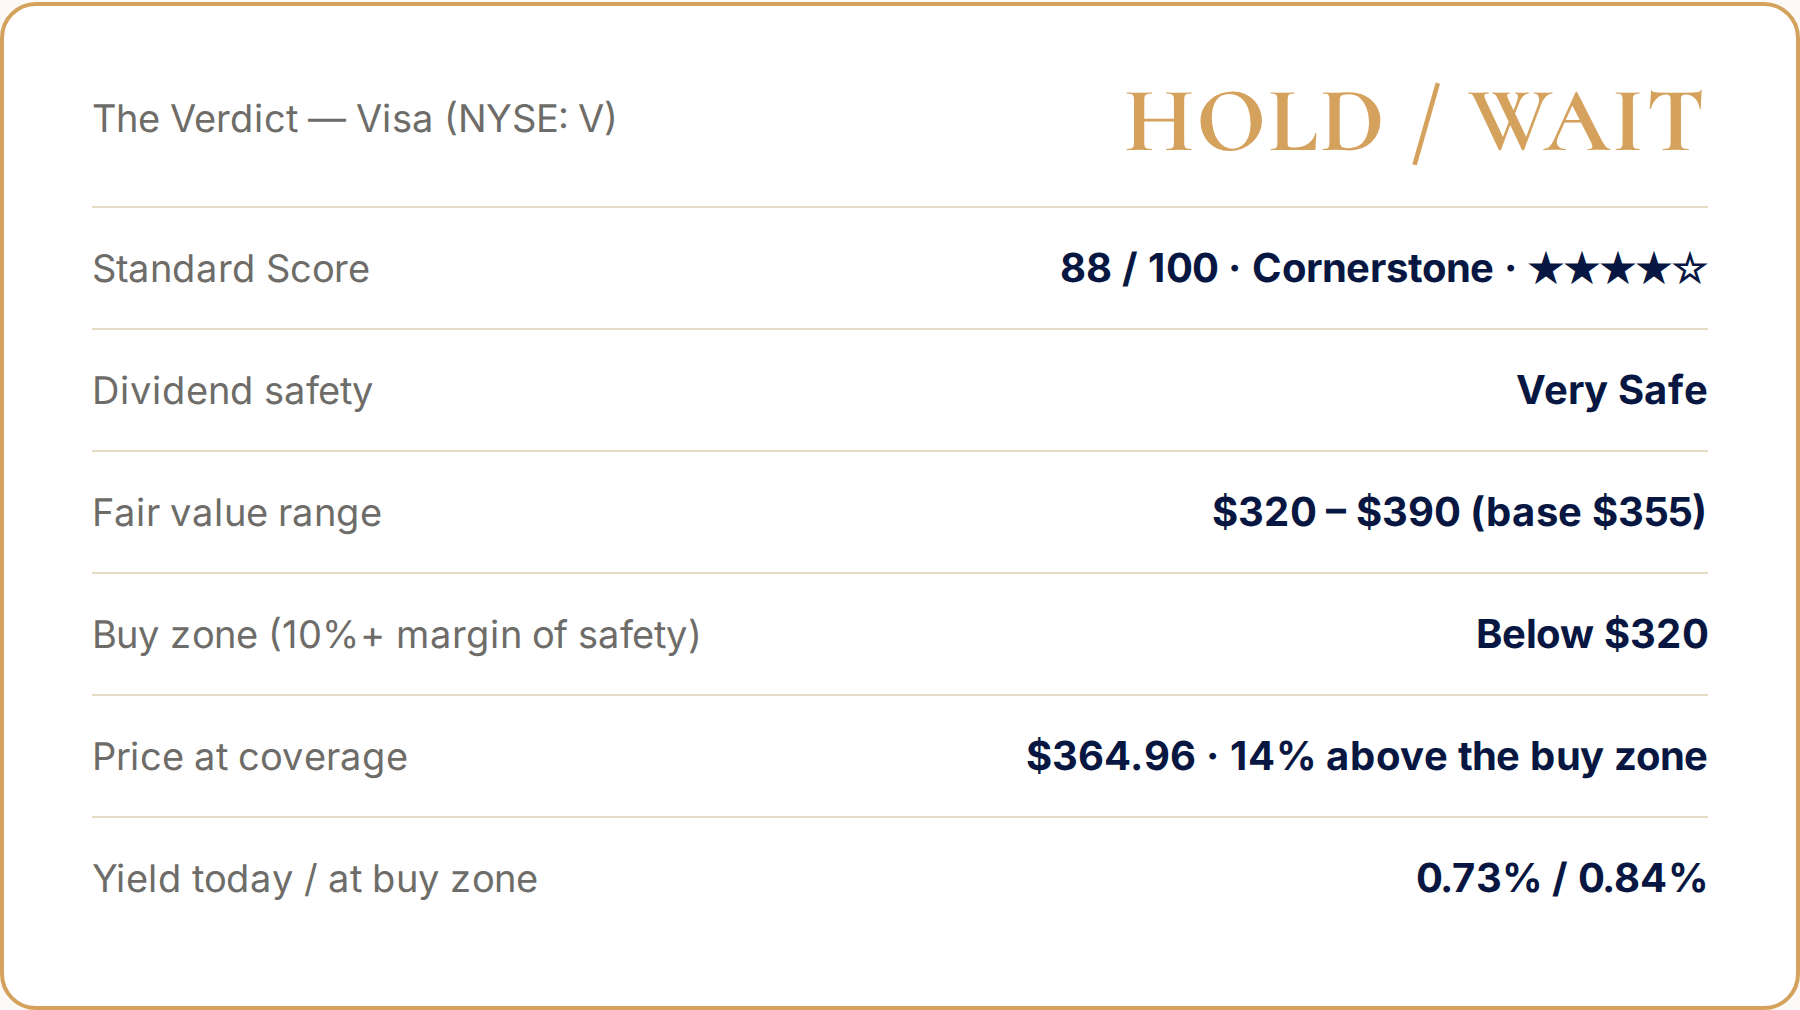
Cornerstone. Hold / Wait — accumulate below $320. Visa is the highest-quality dividend grower I have scored, and its valuation reflects that. At $364 as I write this, the stock already prices in ten years of 10% growth, leaving no cushion for a regulatory outcome that could cut earnings by 6% to 8% in a single year. The business itself is not in question. If you own the stock, hold it. If you don’t, wait for the buy zone, about 12% lower. A CCCA headline is the most likely catalyst to bring the price there in the short-term.