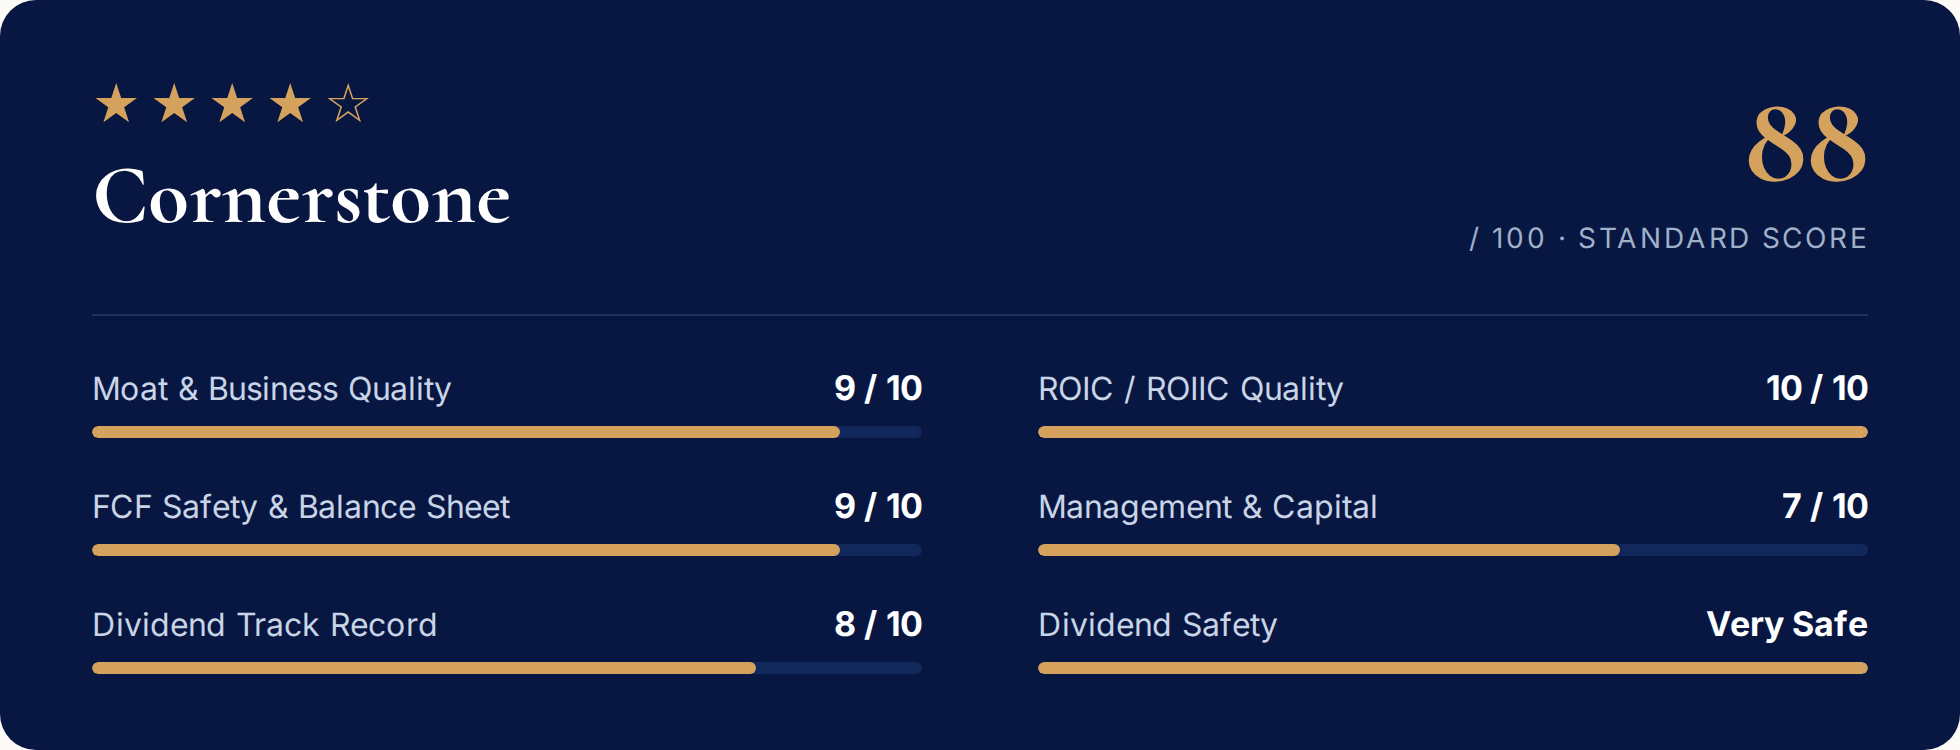
Mastercard pays out 16.8% of its free cash flow as a dividend.
Free cash flow was $16.433 billion in FY2025. Dividends took $2.76 billion. Buybacks consumed most of what was left: $11.7 billion.
Mastercard can return that much because of what it earns on the capital it keeps. It earned 95.4% on average invested capital last year, against a cost of capital near 8.6%. Three-year returns on incremental invested capital (ROIIC) ran 184.3%.
Given the capital-light model, the returns, and the reinvestment runway, Mastercard’s dividend is very safe and can grow at a high rate for a long time.
Business & Moat
Even after all this time as a public company, many people still misunderstand Mastercard’s business.
Mastercard is not a bank or a credit card company. It lends nothing, funds no receivables, and carries no credit risk. It operates a four-party network of cardholders, issuing banks, merchants, and acquiring banks. Mastercard charges a toll for standing in the middle.
A digital network is an asset-light business: $2.3 billion of property against $32.8 billion of revenue.
Mastercard operates two segments.
Payment network produced $19,476M in revenue in FY2025 (59.4% of net revenue): domestic assessments on dollar volume, cross-border assessments, and a processing fee for authorization, clearing, and settlement.
Value-added services (VAS) is the newer segment. It produced $13,315M in FY2025 (40.6% of net revenue) — the software business, covering fraud and cyber, identity, consulting, data, gateway, open finance, and real-time rails. VAS grew 22.9% in FY2025 against 12.3% for the network.
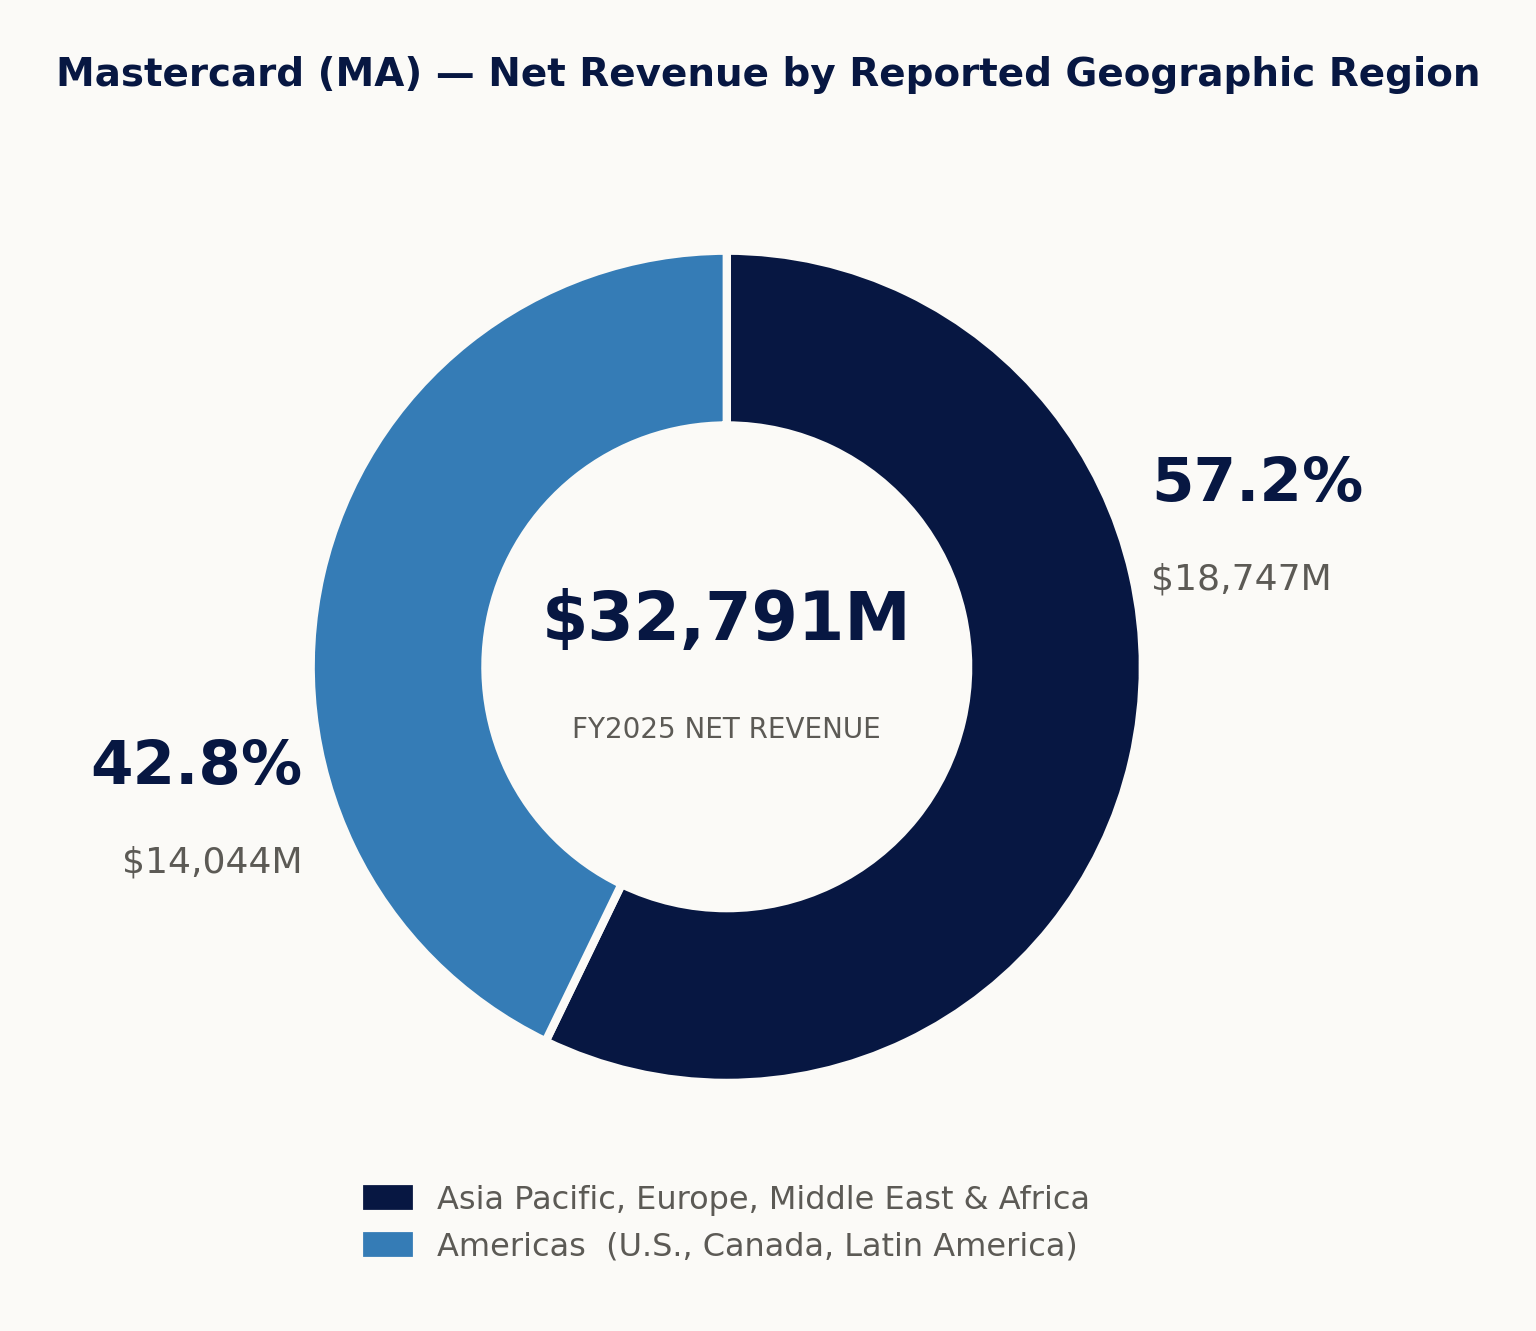
The Americas account for 42.8% of Mastercard’s total revenue, and the U.S. alone for about 29%. The rest of the world makes up the other 57.2%.
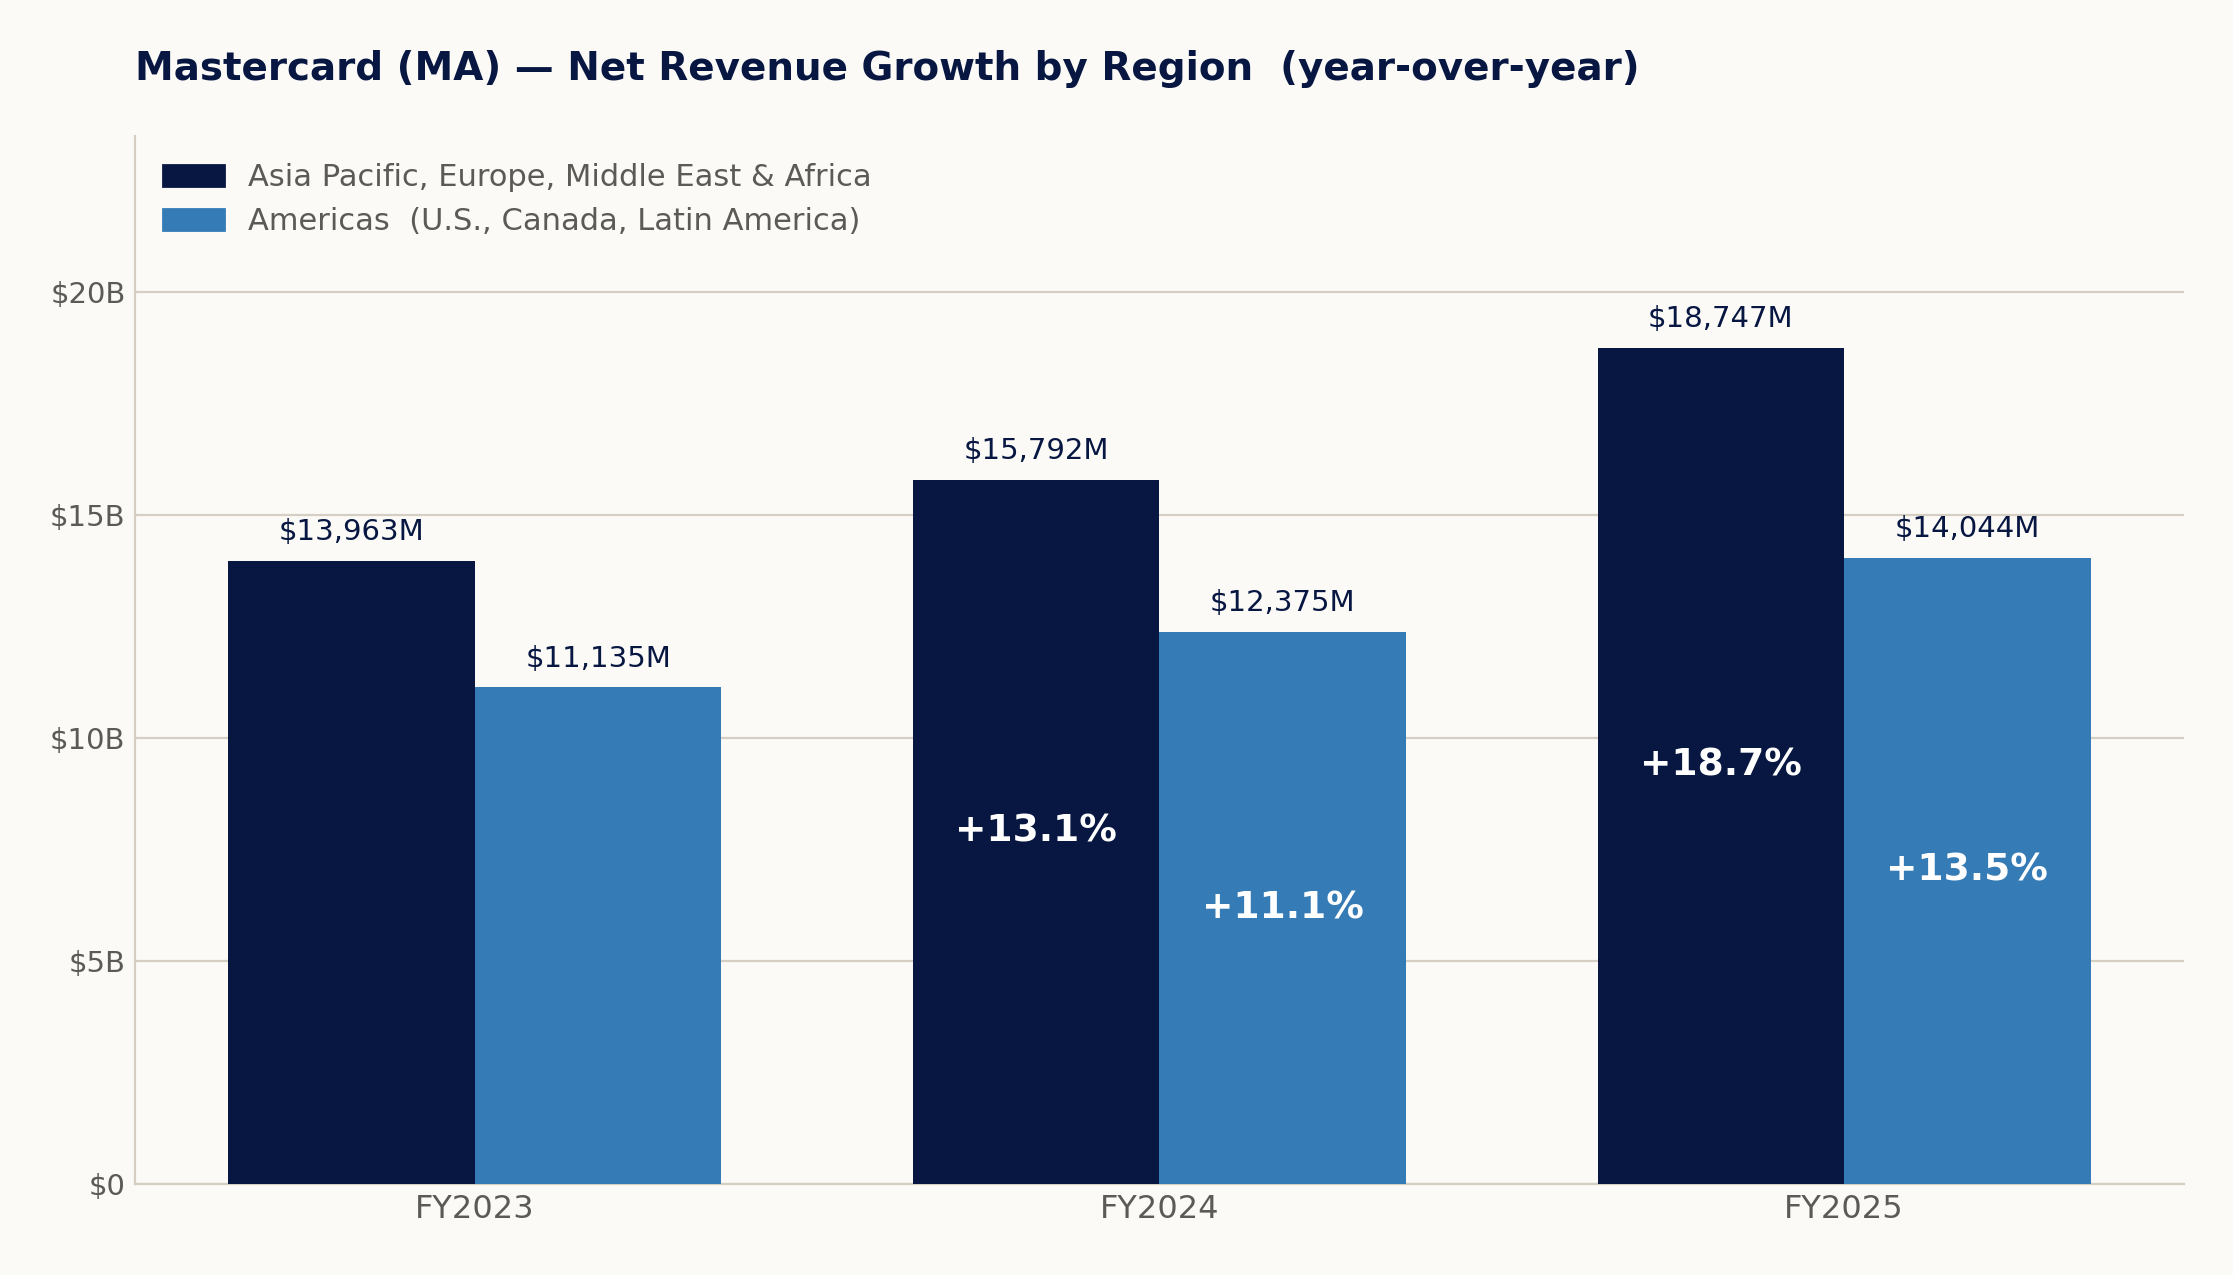
The rest of the world is growing faster than the Americas.
The load-bearing moat
Mastercard’s multi-party network connects consumers, merchants, and financial institutions, and each participant makes it more valuable to the others. The more consumers use Mastercard, the more merchants want to accept it, and the more banks want to issue Mastercard-branded cards. Global share runs 29% in credit cards and 24% in debit.
A data layer sits on top. More transactions generate proprietary data, which improves the fraud and identity products and gives issuers more reason to route volume through Mastercard’s own rails.
Scale adds another advantage. Incremental transactions cost close to nothing to process. FY2025 revenue grew 16.4% while operating expenses grew 10.4%, and total D&A was $1,143M, 3.5% of revenue.
The evidence
Network and scale give Mastercard pricing power. Operating margin expanded 180 bps year over year to 57.6% in FY2025.
Assessments grow faster than volume:
Domestic assessments +10% against worldwide gross dollar volume +8%
Cross-border assessments +20% against cross-border volume +12%
Transaction processing +12% against switched transactions +9%
Moat rating: Wide. Two-sided network effects with a data flywheel, reinforced by a cost structure no subscale entrant can match, and confirmed by pricing that runs ahead of volume year after year.
Dividend History
Mastercard raised its quarterly dividend to $0.87 in December 2025, a 14.5% increase, and authorized a new $14 billion buyback alongside it. That marks 15 consecutive years of increases. Not an aristocrat — that takes 25 years — but a challenger closing in.
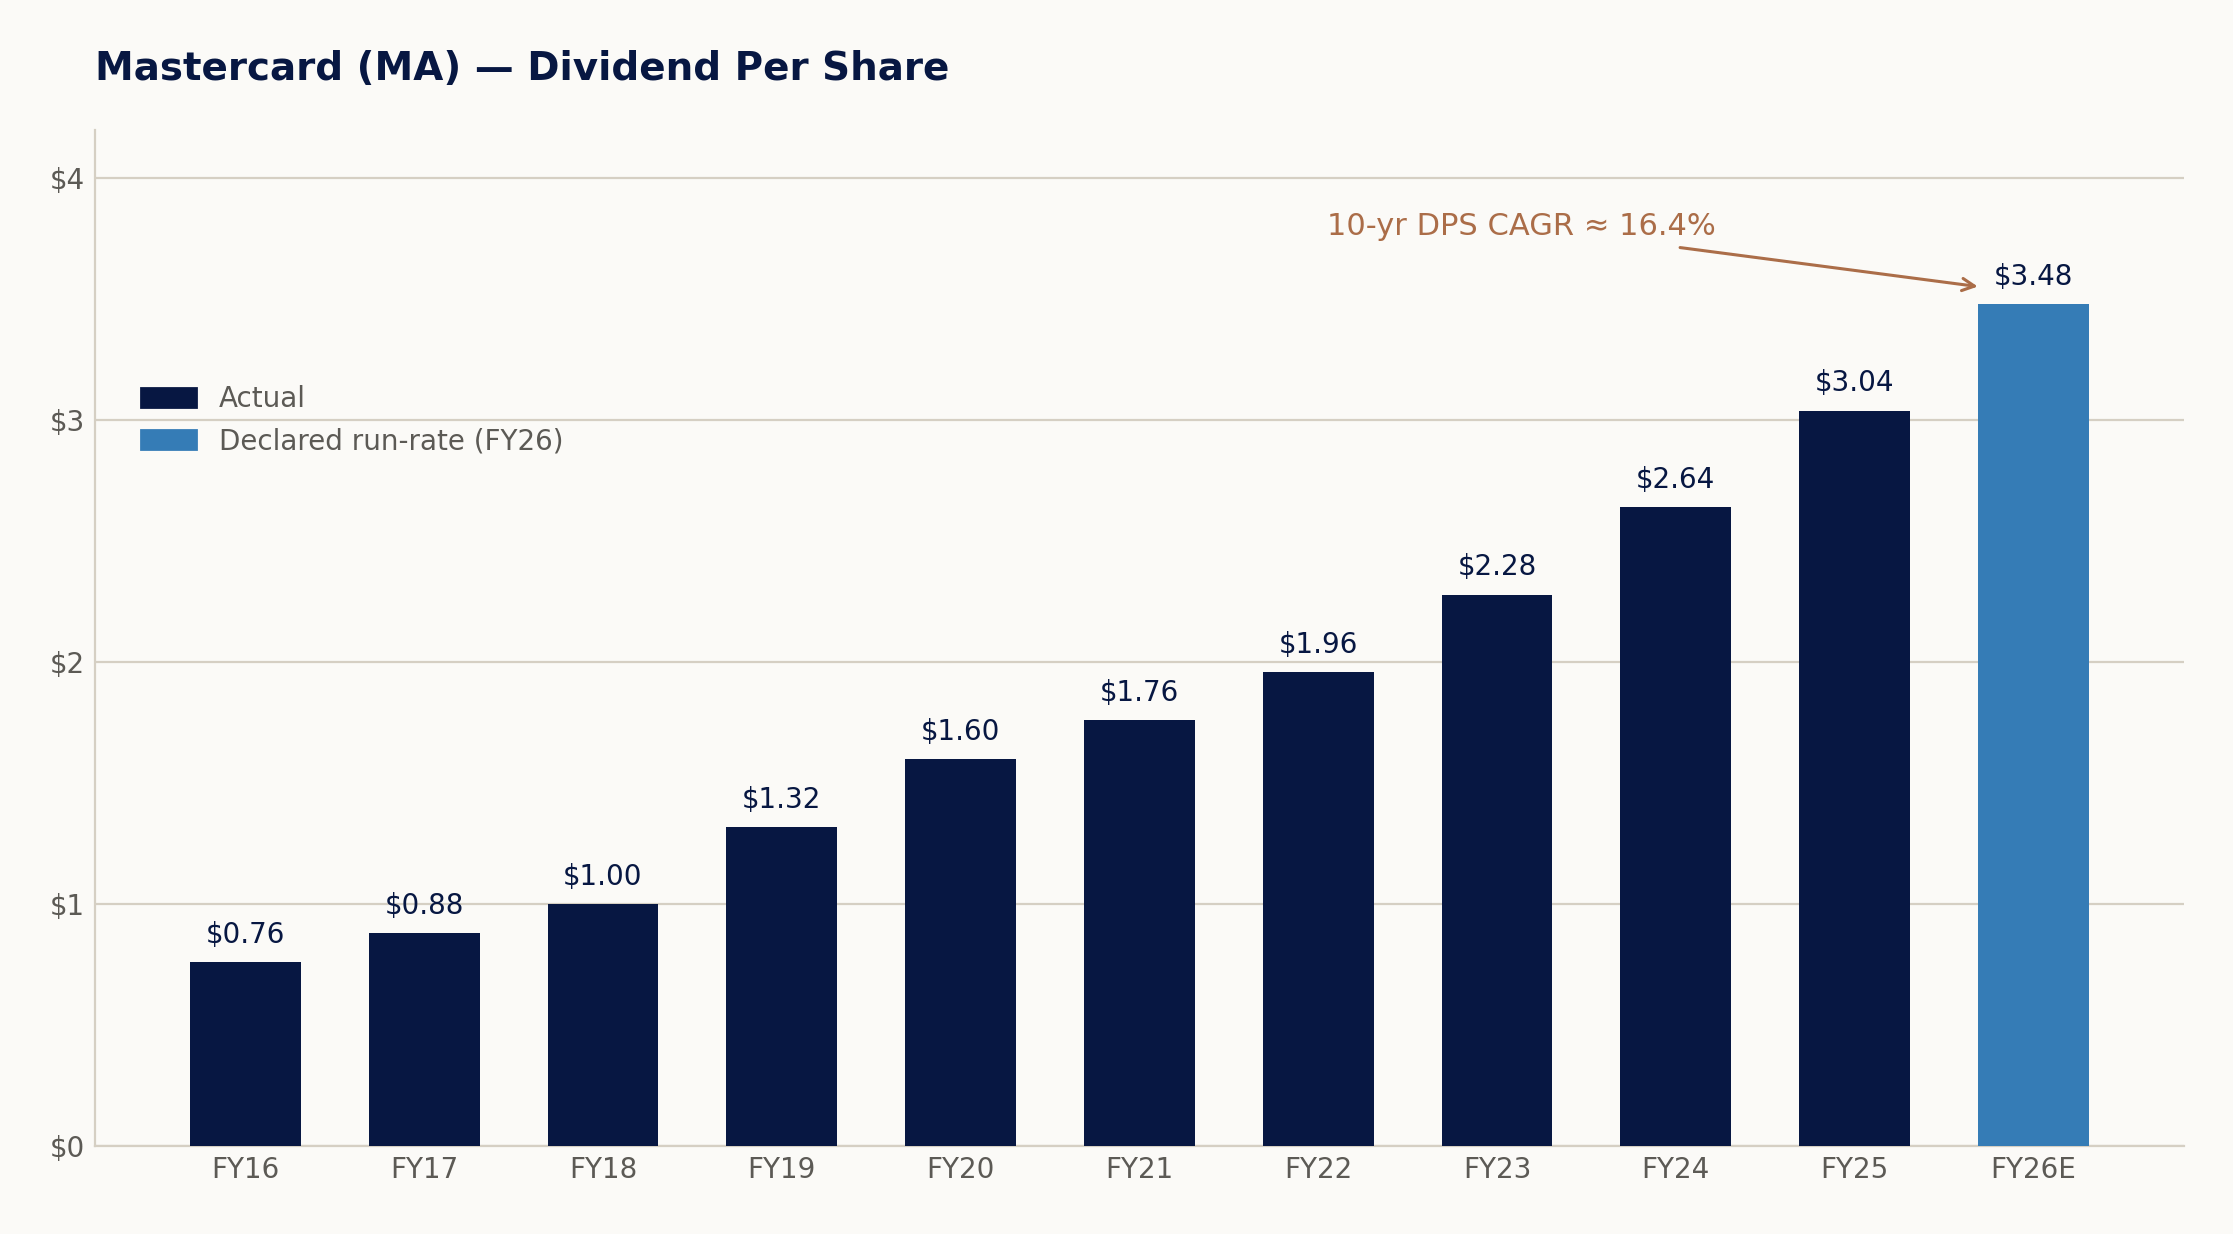
The forward annual rate is $3.48, a 0.60% yield at $580.63.
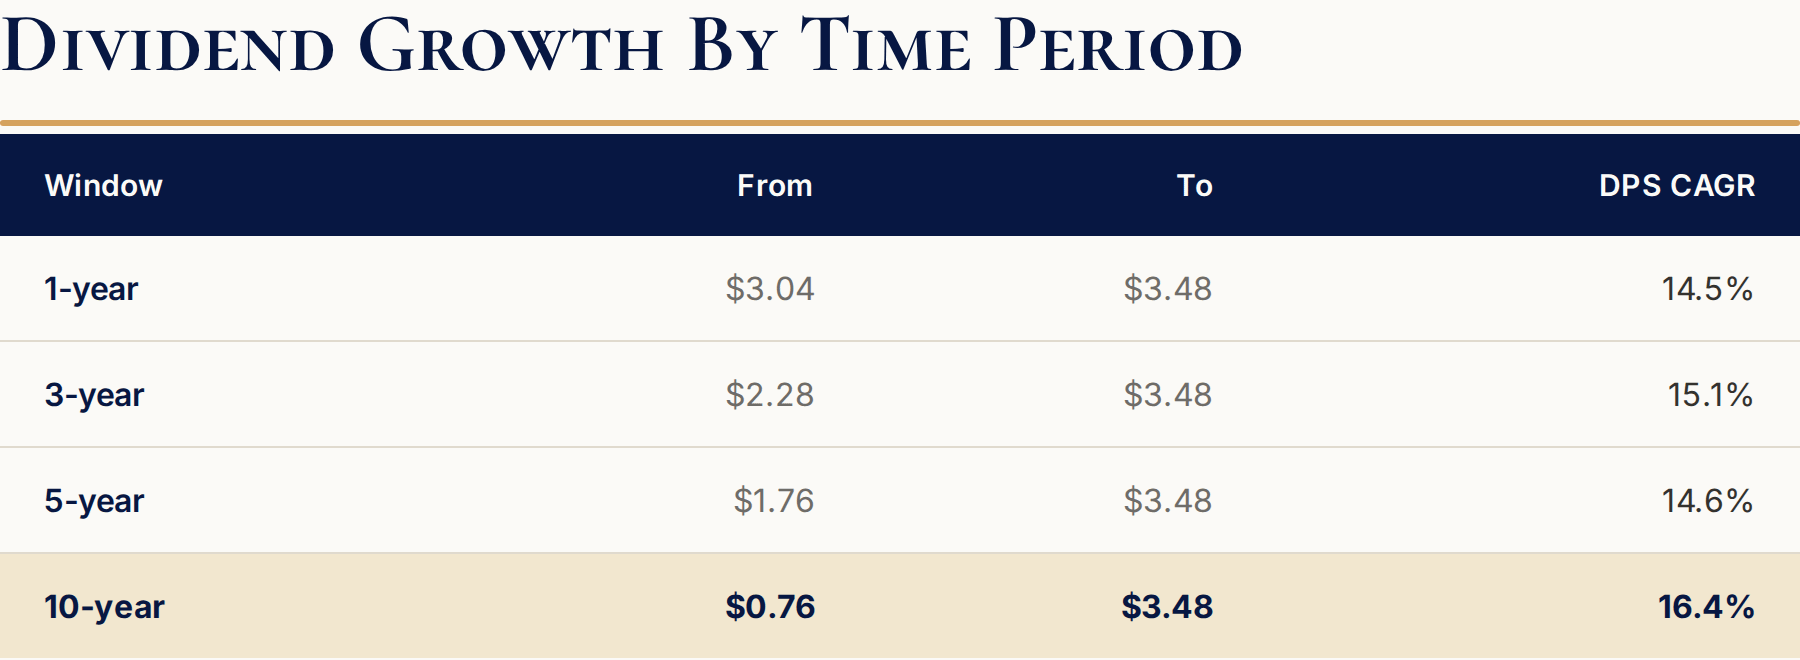
Ten years of roughly 16% compounding, and no year where the increase came in under 10%. The largest single raise over the last ten years was 32% in 2019, when the quarterly dividend went from $0.25 to $0.33.
The consistency check
A dividend compounding faster than the cash that funds it is borrowing from the future.
Mastercard runs the other way.
Free cash flow per share compounded at 22.9% over the five years ending FY2025. The dividend compounded at 14.6%over the same window. Mastercard’s payout ratio fell from 25.7% of earnings in 2020 to 18.4% in 2025.
At an 18% payout ratio, Mastercard could grow the dividend faster than free cash flow for a decade and still be under 40% of it. The constraint on dividend growth here is not capacity. It is management’s willingness.
FCF Coverage & Balance Sheet
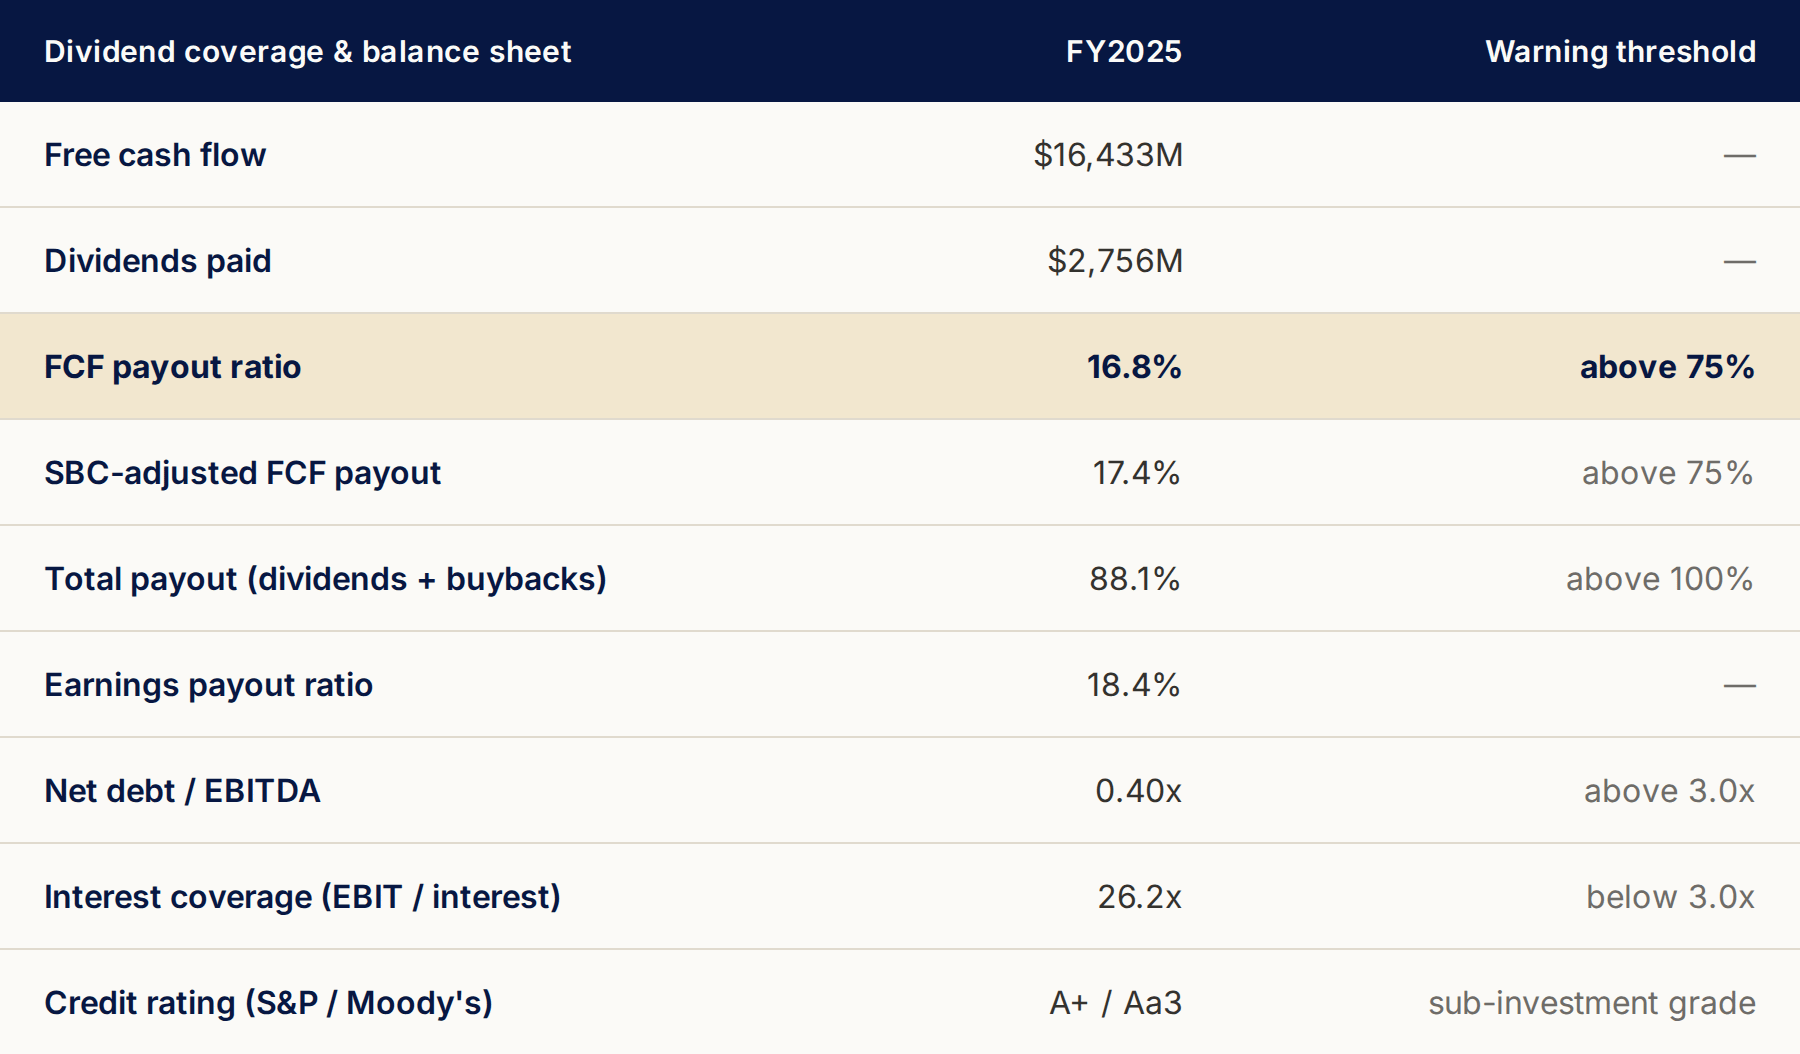
The dividend consumes 16.8% of free cash flow, and 17.4% after subtracting every dollar of stock-based compensation.
The dividend is well covered.
Interest coverage is 26.2x.
Net debt to EBITDA was 0.40x at year-end 2025.
S&P rates the senior unsecured A+, Moody’s Aa3, both stable.
The maturity ladder is spread across 2026–2030 and beyond, mostly fixed-rate coupons issued in the low-rate era. An $8 billion commercial-paper program and an $8 billion revolver to November 2030 sit undrawn behind it.
Dividend safety: Very Safe.
ROIC / ROIIC Breakdown
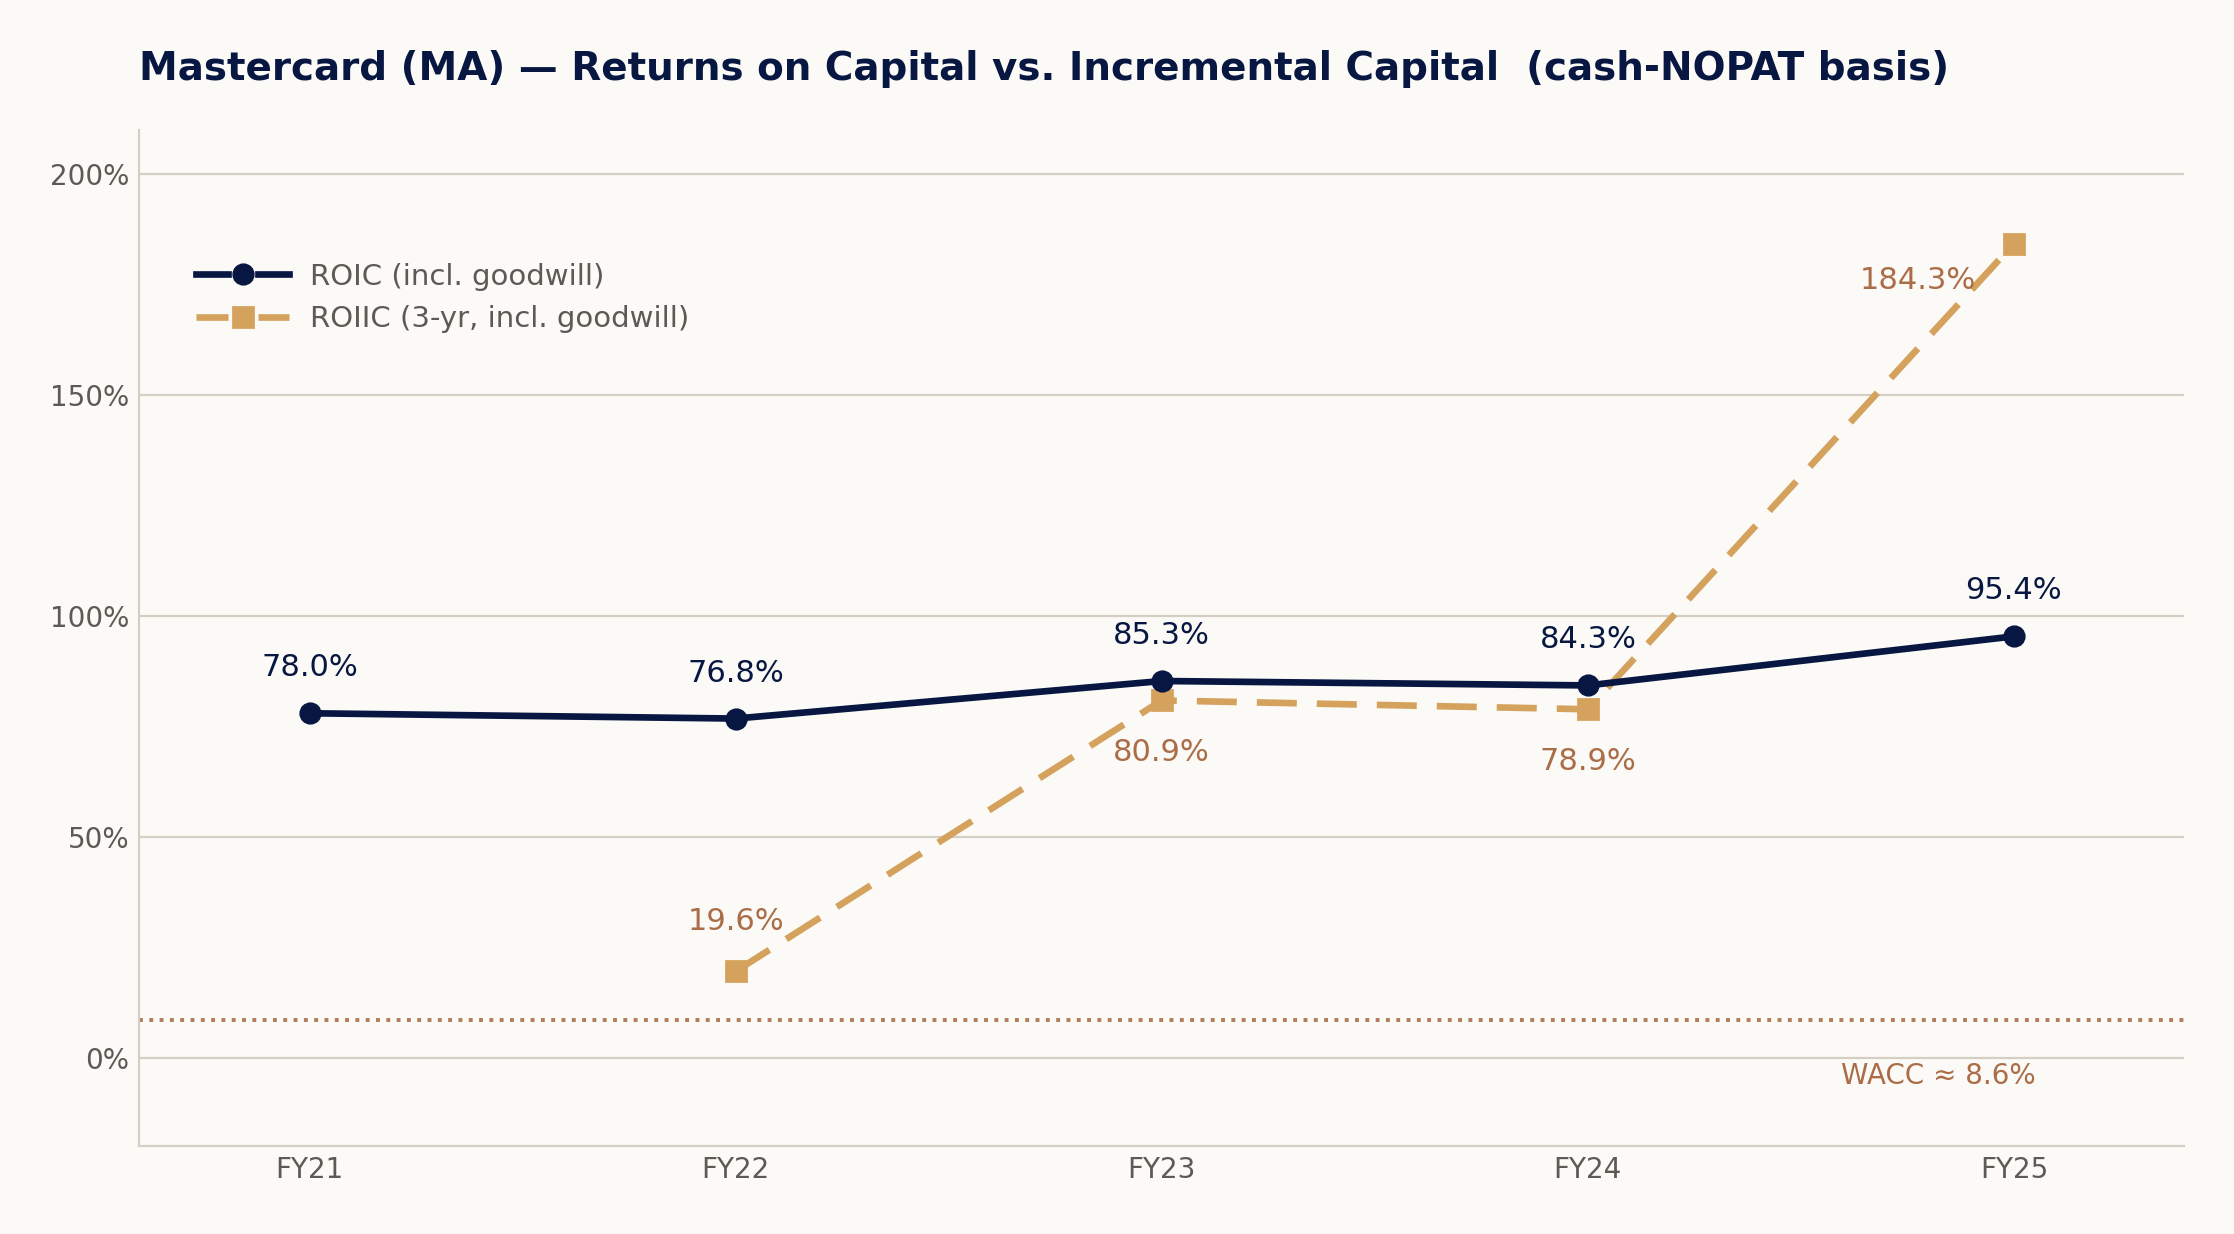
Built on a cash-NOPAT basis: operating income plus acquired-intangible amortization and the lease-interest component, less cash taxes actually paid, over average operating invested capital.
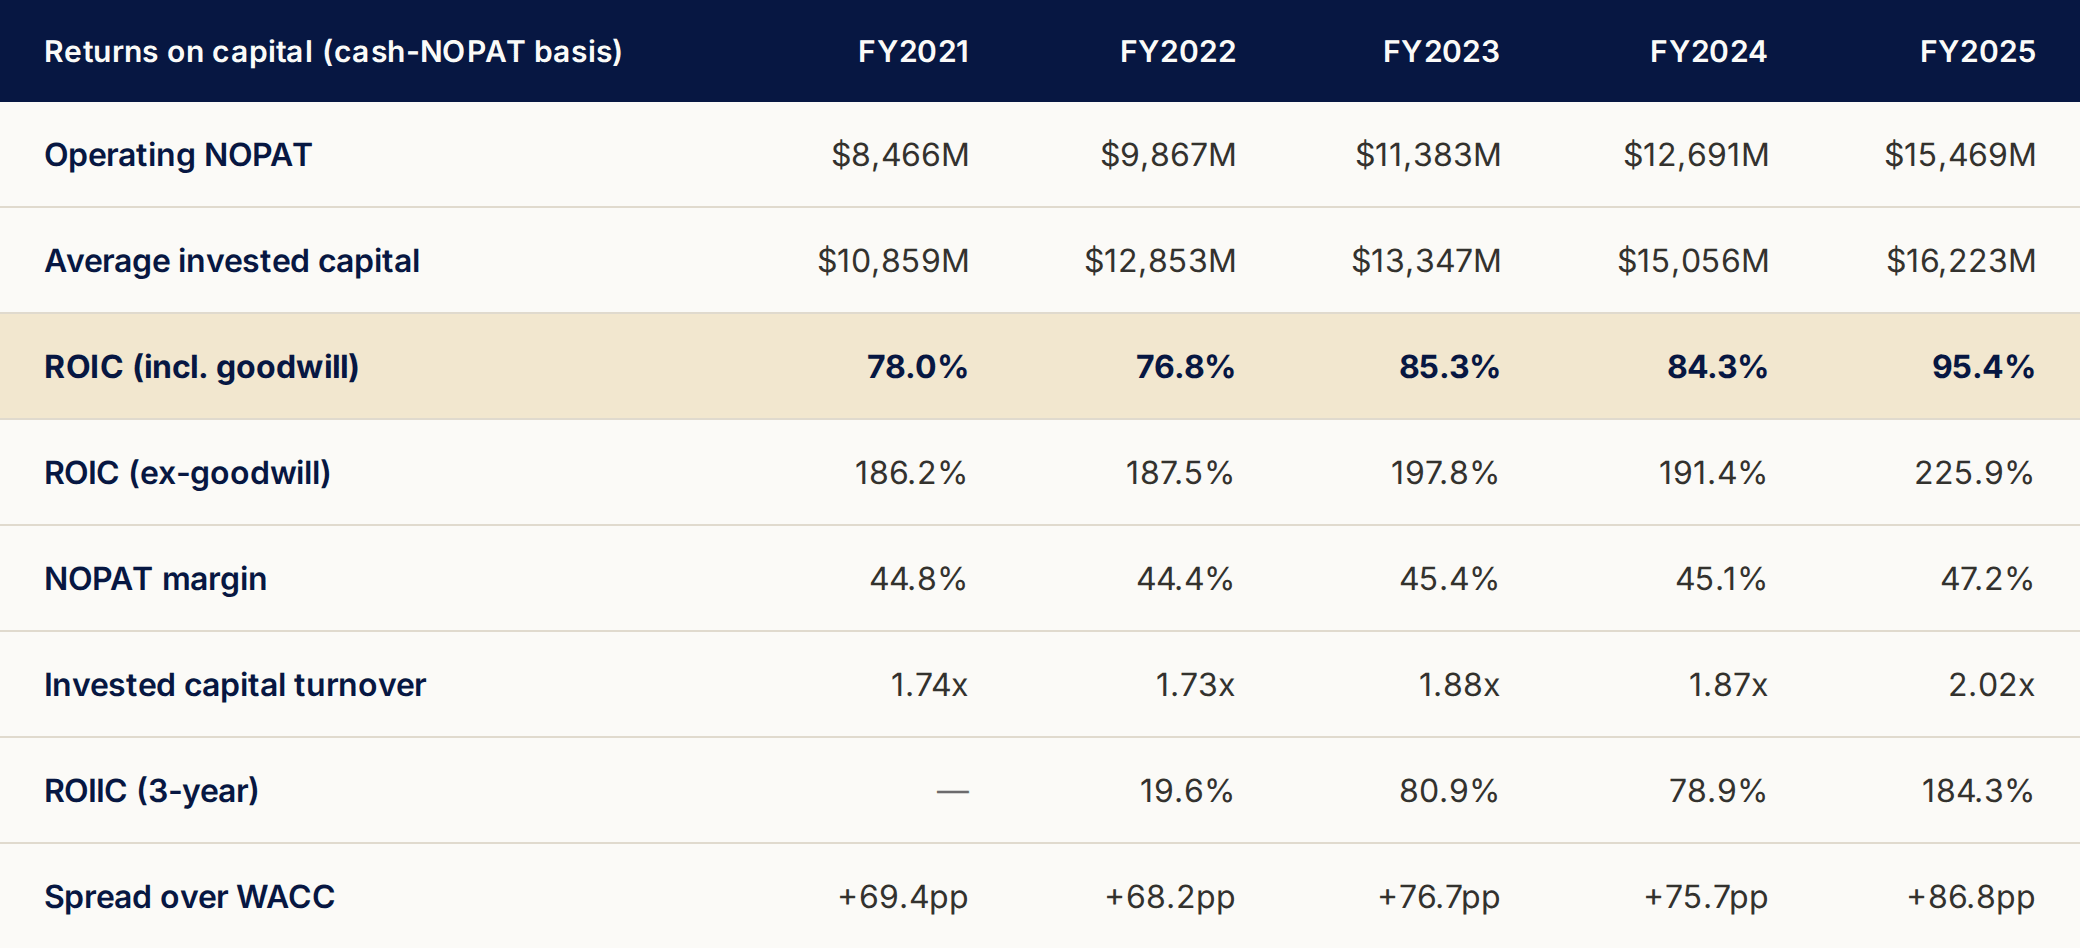
Both DuPont levers — margin and turnover — improved in 2025. NOPAT margin rose from 45.1% to 47.2%; invested-capital turnover from 1.87x to 2.02x. Most businesses trade one for the other.
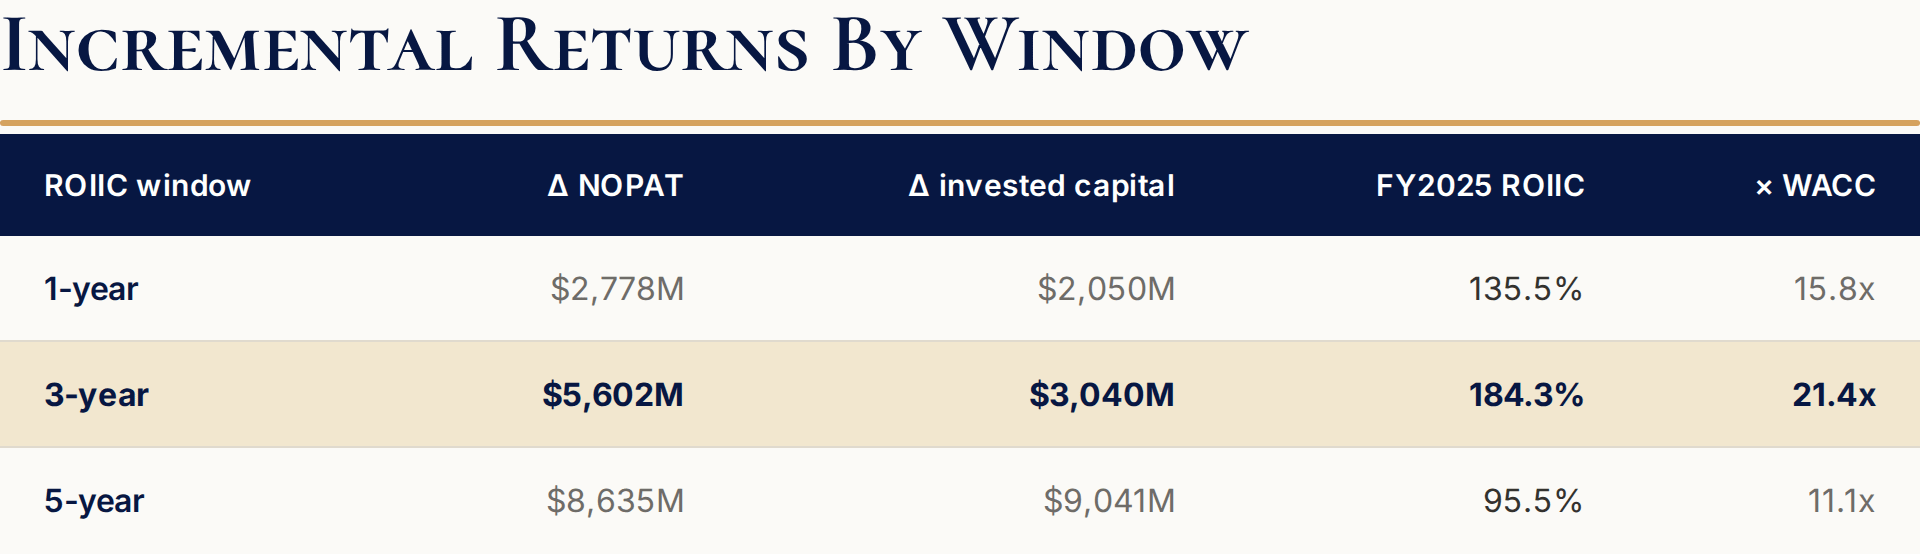
ROIIC exceeds ROIC.
The three-year reading of 184.3% sits above the 95.4% average, which is why ROIC keeps climbing. Mastercard still has high-returning places to put capital.
For dividend investors, as Mastercard grows, it will keep producing excess capital it doesn’t need to reinvest. That capital goes back to shareholders through dividends and buybacks.
Growth Catalysts
Near-term
Sentiment
The multiple has already compressed from a 37.8x ten-year median to 31.1x trailing. Any clarity on the Credit Card Competition Act or the UK Payment Systems Regulator’s fee review — positive or negative — would resolve the largest single discount embedded in the price.
Mastercard’s VAS business wasn’t immune to the “SaaSpocalypse” fears that hit other software companies. I don’t think investors fear AI disrupting the payment networks, but VAS is Mastercard’s fastest-growing business, and AI could displace parts of it.
If VAS keeps growing in an AI-driven world, that fear is misplaced.
The new $14 billion buyback could support the stock in the near term.
Bill Ackman’s Pershing Square has disclosed a new position in Mastercard. A widely followed investor taking a stake can be enough to shift sentiment on a name.
Long-term
Cash to Digital
McKinsey puts total cash transactions in 2024 at $26 trillion. The developed world is far along in the cash-to-digital shift; much of the developing world still transacts primarily in cash.
Not all of that cash will go digital, and not all of what does will run through Mastercard’s network. But some will — and capturing even a few trillion dollars of that volume would be meaningful.
The bigger benefit is that digital payments make commerce easier and increase spending, per Visa.
In fact, Moody’s found that just a 1 percent increase in card usage across those 70 countries and territories produces on average an additional $65–70B annually in consumption of goods and services, which in turn supports local business and drives overall growth. “That creates a virtuous cycle: increased spending generates production, jobs, income, and GDP, which generates more spending, and increasing use of electronic payments facilitates that virtuous cycle,” says Zandi.
E-commerce
Mastercard is the toll booth for e-commerce.
Every online transaction requires some form of digital payment, and Mastercard’s brand, security features, and acceptance make it a default choice for consumers and merchants.
E-commerce is expected to reach 22-23% of global retail sales by 2029. It should continue to grow with overall consumer spending while taking a larger share of retail—driving volume growth for Mastercard, which charges about 0.13% of the gross dollar amount plus a processing fee per transaction.
Consumers are also increasingly buying from international merchants through Amazon, Alibaba, and Shopify. Mastercard adds 0.4% for cross-border transactions and another 0.2% for currency conversion.
A 0.13% assessment on gross dollar volume becomes 0.73% (0.13% + 0.40% + 0.20%) on a cross-border transaction with currency conversion.
BNPL and Digital Wallets
New payment options — Buy Now, Pay Later (BNPL) and digital wallets — expand Mastercard’s network and increase transaction volume.
Rather than build costly new payment networks, BNPL companies run on Visa’s and Mastercard’s existing infrastructure to reach consumers and merchants immediately.
Most BNPL accounts are paid through a Visa- or Mastercard-branded debit card. BNPL purchases typically involve higher transaction values, which raises gross dollar volume. Splitting payments into four or more installments raises processing fees.
Most digital wallets are backed by the same branded cards, and they are another channel pushing volume through the network.
B2B Payments
B2B payments cover accounts payable and supplier payments, travel and entertainment, procurement, and fleet fuel cards.
The global B2B payments market is estimated at $120 trillion, with 10%–13% of those payments digital.
Mastercard is targeting B2B partly because so little of it is digital, and partly because these transactions are often higher value and frequently cross-border, which requires currency conversion.
Why would a business pay these higher fees when it could keep paying by check, ACH, or wire?
Speed. Mastercard can settle in real time or same day, against the one to three business days ACH takes.
Accuracy. Digital payments cut manual-entry errors and the labor of payment tracking, and companies can embed Mastercard’s tools directly into their workflows.
Fraud. Digital rails lower fraud risk.
Working capital. This is the real one. Speed and predictability let a company manage cash flow better, and poor cash flow management is one of the leading causes of business failure.
Value-Added Services
Value-added services covers everything beyond core payment processing: Security Solutions, Customer Acquisition & Engagement, Business Insights, and Digital Authentication Services. The point is to make Mastercard’s customers — banks, merchants, and businesses — better at their own jobs.
Financial institutions use these tools to cut fraud losses while gaining insight into spending patterns, then layer on services to improve customer acquisition and build new payment products.
Merchants get cybersecurity tools and tokenization to reduce chargebacks, plus Customer Acquisition & Engagement programs to lift transaction volume and retention.
Businesses get expense-management tools for control over employee spend and fraud detection for high-value transactions.
The more a customer adds on top of core payment processing, the higher the switching costs.
Mastercard doesn’t disclose VAS margins. What it does disclose: VAS was roughly 41% of total revenue in Q2 2026, a quarter in which overall operating margin improved from 58.7% to 60.2% on revenue up 14% year over year.
Management & Capital Allocation
Michael Miebach has been CEO since January 2021 and with the company since 2010, previously as Chief Product Officer and President. Under him, revenue rose from $18.9 billion to $32.8 billion and ROIC from 78% to 95%.
The CFO seat just turned over. Sachin Mehra, CFO for more than seven years, moved to Chief Business Officer in August 2026. Ling Hai took the CFO role on August 3, promoted from President of Asia Pacific, Europe, Middle East, and Africa. The region that generates 57.2% of revenue.
Management’s annual bonus is tied two-thirds to adjusted net income and one-third to adjusted net revenue. Long-term PSUs (Performance Stock Units) are based on 50% EPS and 50% net revenue, modified by relative TSR (Total Shareholder Returns) against the S&P 500.
No return-on-capital metric appears anywhere in the plan. Nothing on free cash flow per share either.
Mastercard retired $11.7 billion of stock in 2025 and $8.9 billion in the first half of 2026 alone. Shrinking the share count by 2.2% a year mechanically inflates the EPS. Management disclosed that buybacks contributed $0.14 to Q2 2026 EPS.
M&A has been good.
Recorded Future ($2.65B, closed December 2024) is already producing. Threat Intelligence identified 7 million card-testing transactions across 192 countries and prevented an estimated $172 million in fraud.
BVNK closed at $1.5 billion plus a $300 million earnout — roughly 15x EBITDA on an asset growing volume at 130% a year. It brings more than 25 licenses across 130 markets and direct SEPA instant access. Buying the interoperability layer rather than betting on a coin is the right call.
Overall: operationally excellent, adequate as allocators. No value destruction. But no evidence of the countercyclical opportunism that distinguishes the great allocators either.
Peer Comparison

Visa is the only true like-for-like comparison. American Express is a closed-loop network that funds its own receivables, which is why its returns aren’t comparable on any invested-capital basis and why it carries credit risk Mastercard does not.
Mastercard yields the least of the three and has the most room to raise. Its payout ratio is the lowest on a free-cash-flow basis, and its dividend streak is two years shorter than Visa’s and ten years longer than Amex’s — Amex froze its payout through the pandemic.
Mastercard also trades at the highest forward multiple of the three, and it should. It has the fastest revenue growth (16.4% in FY2025 against Visa’s 12.2%), the highest incremental returns, and the smallest base. Amex at 17.6x forward is a different asset with a loan book attached.
Valuation
At $580.63, Mastercard carries a $509 billion market capitalization and a $517 billion enterprise value.
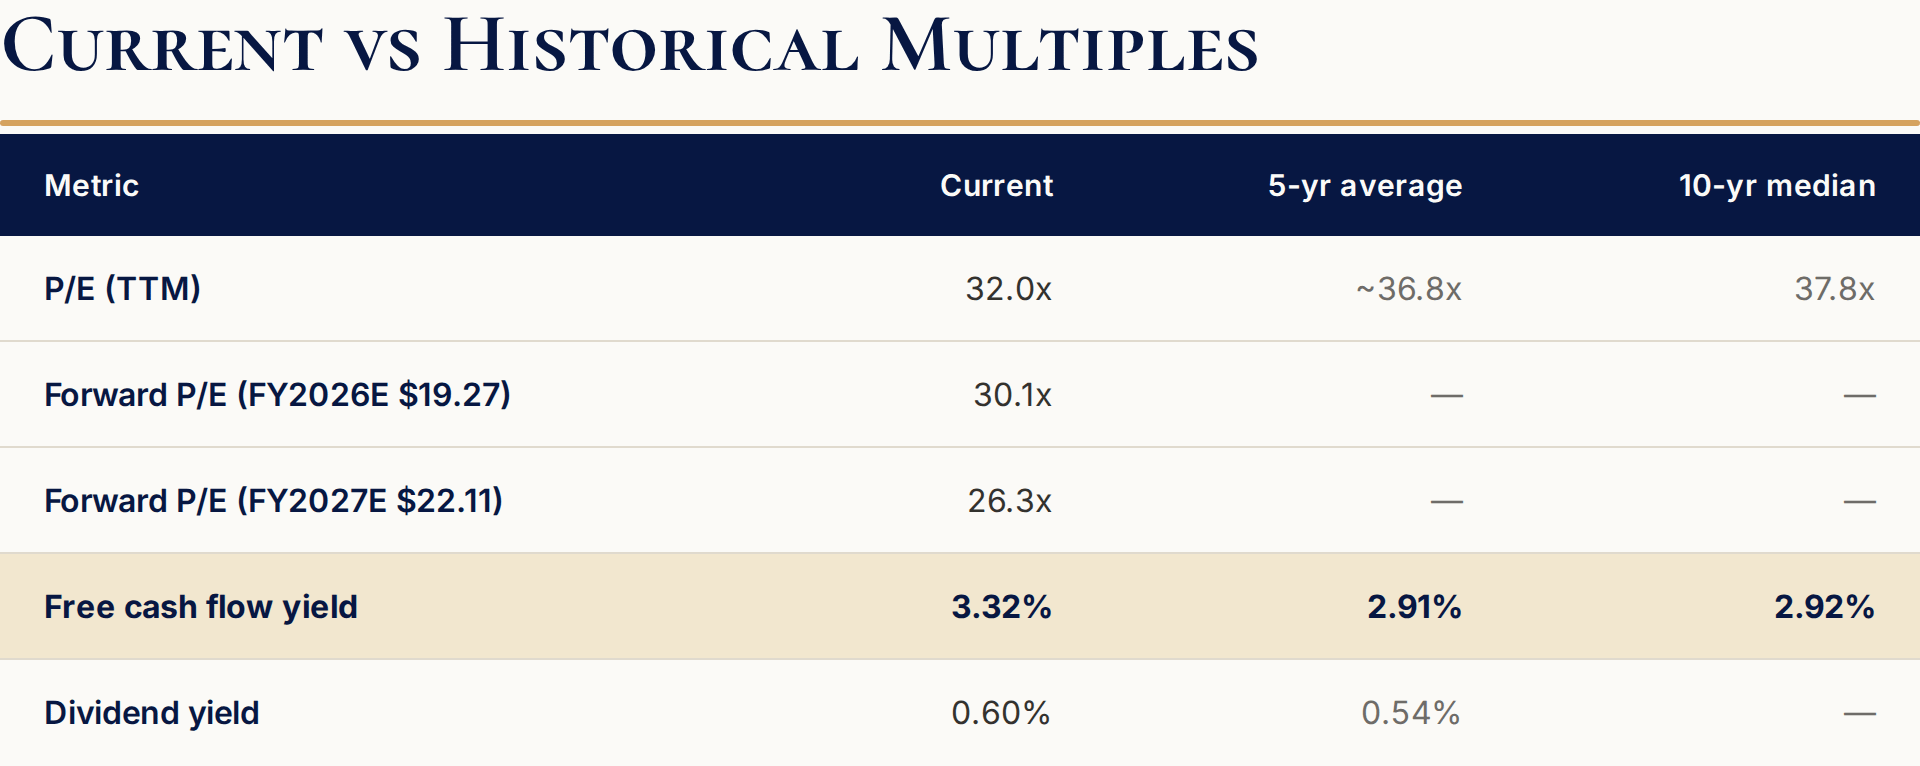
Mastercard currently trades below its five- and ten-year median P/E multiples, while its FCF yield and dividend yield sit above their multi-year averages.
What the market is pricing in
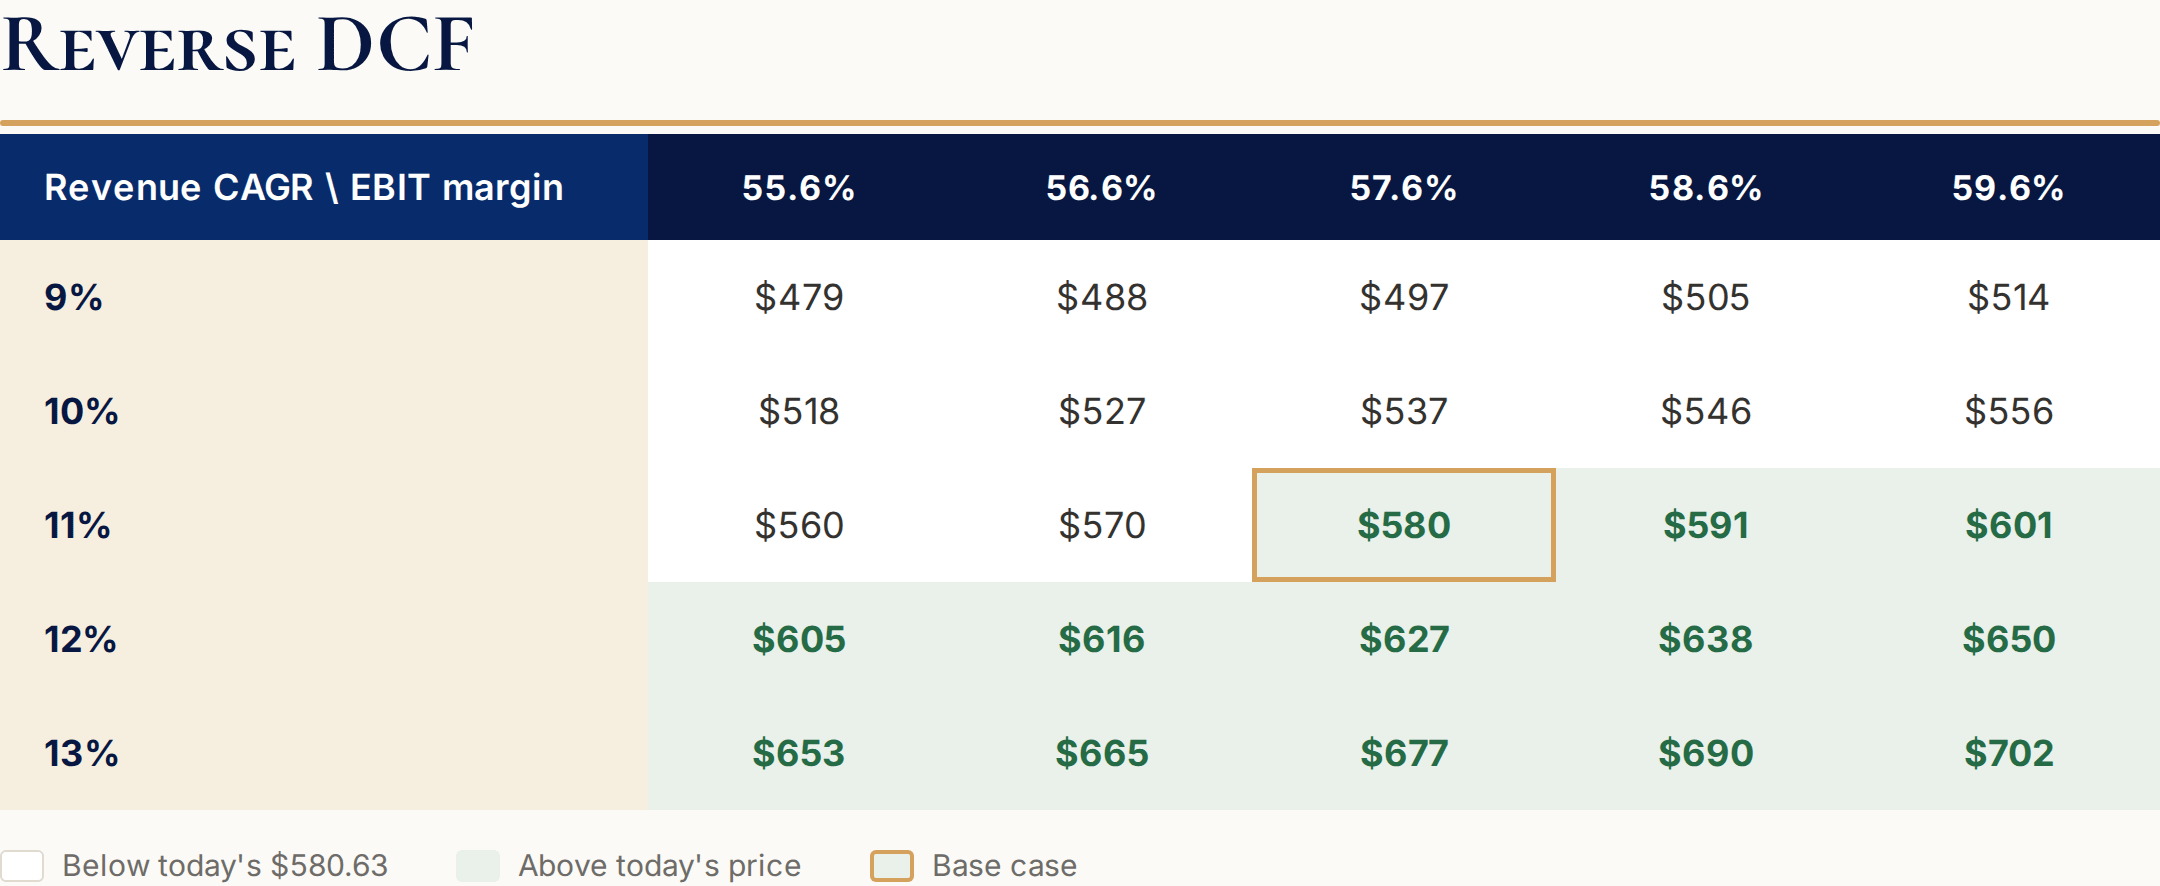
Solve backward from today’s enterprise value — FY2025 operating margin held flat at 57.6%, an 8.6% cost of capital, 3.0% terminal growth — and the price implies a 11.0% revenue CAGR over the next decade.
Mastercard compounded revenue at 14.7% over the three years to FY2025. My own forecast carries 11.2% over the next ten. The market is pricing in my base case.
Fair value
Discounting the ten-year unlevered free cash flow forecast at 8.6% with 3.0% terminal growth produces $614 per share.
At 2.5% terminal growth, the same model produces $578. Add 50 bps to the discount rate as a regulatory-risk premium and it falls to $527. Take the friendlier corner — 8.1% and 3.0% — and it reaches $683.
Fair value range: $527 to $683, base $578.
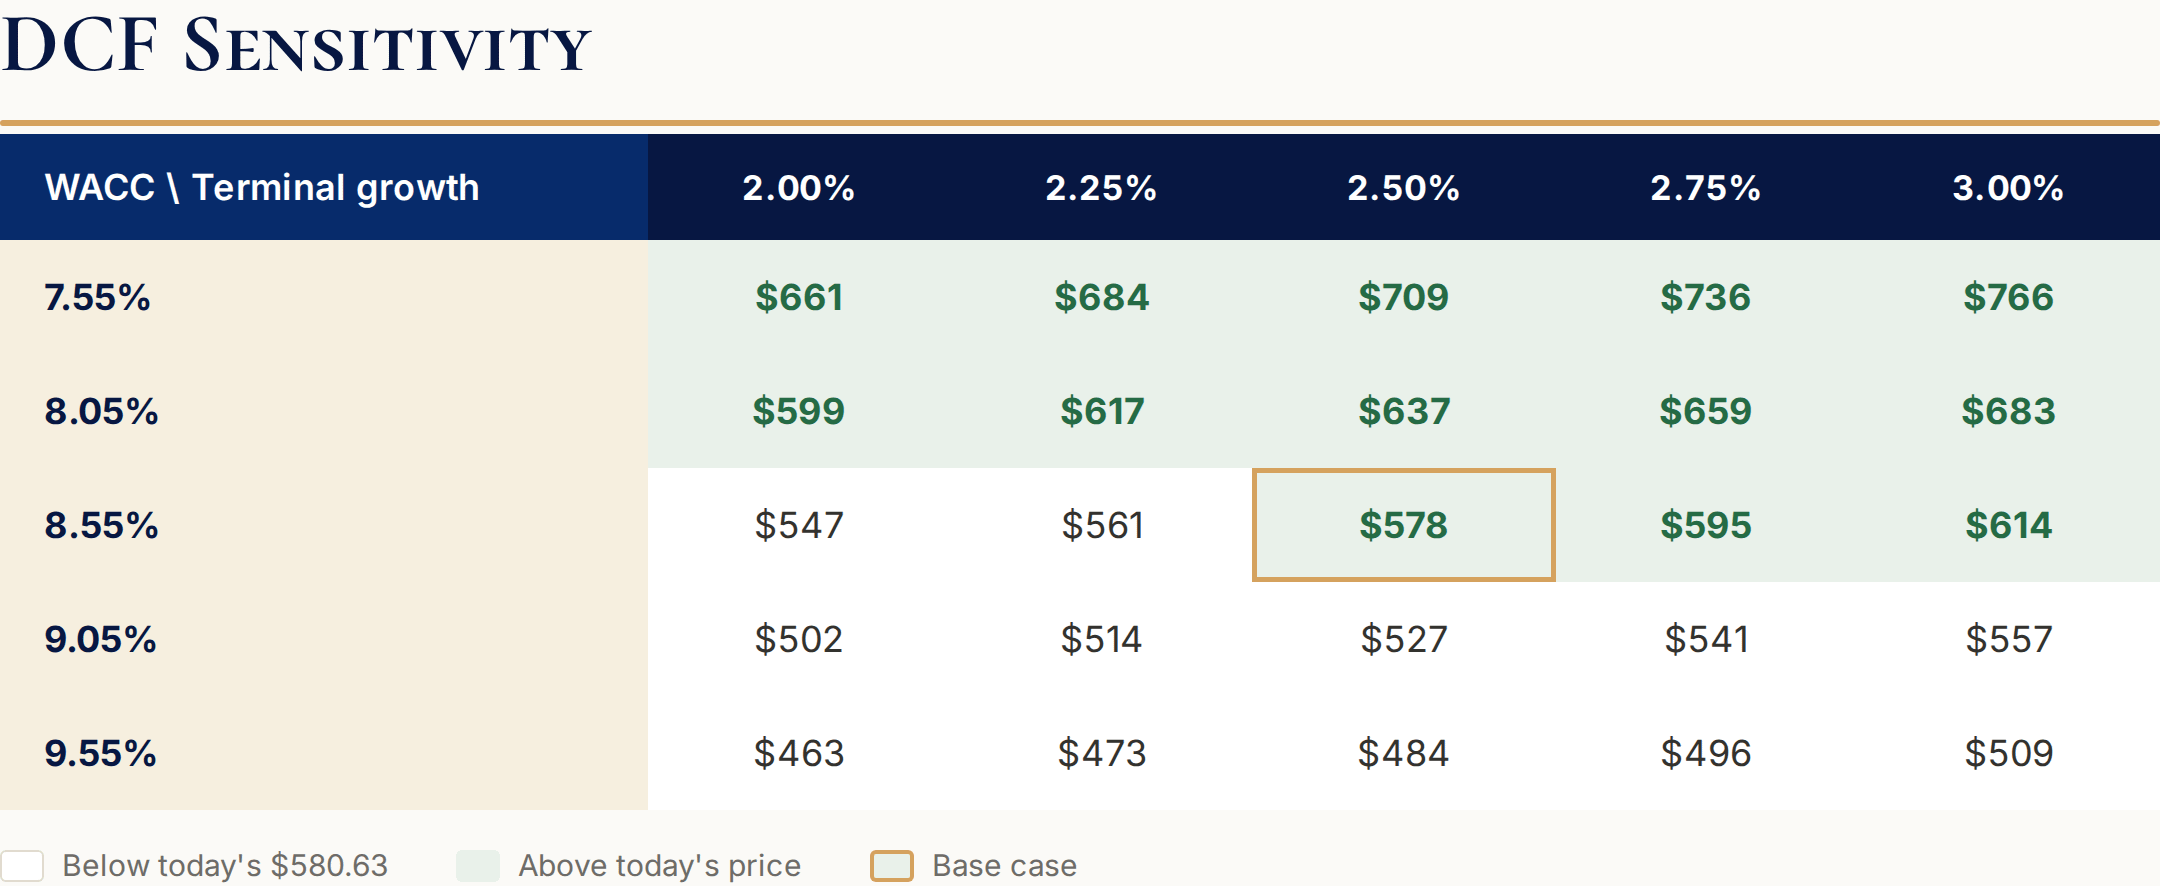
At $580.63 the shares trade roughly inline with the base case. A 10+% margin of safety puts the buy zone below $520.
The Verdict & Buy Zone
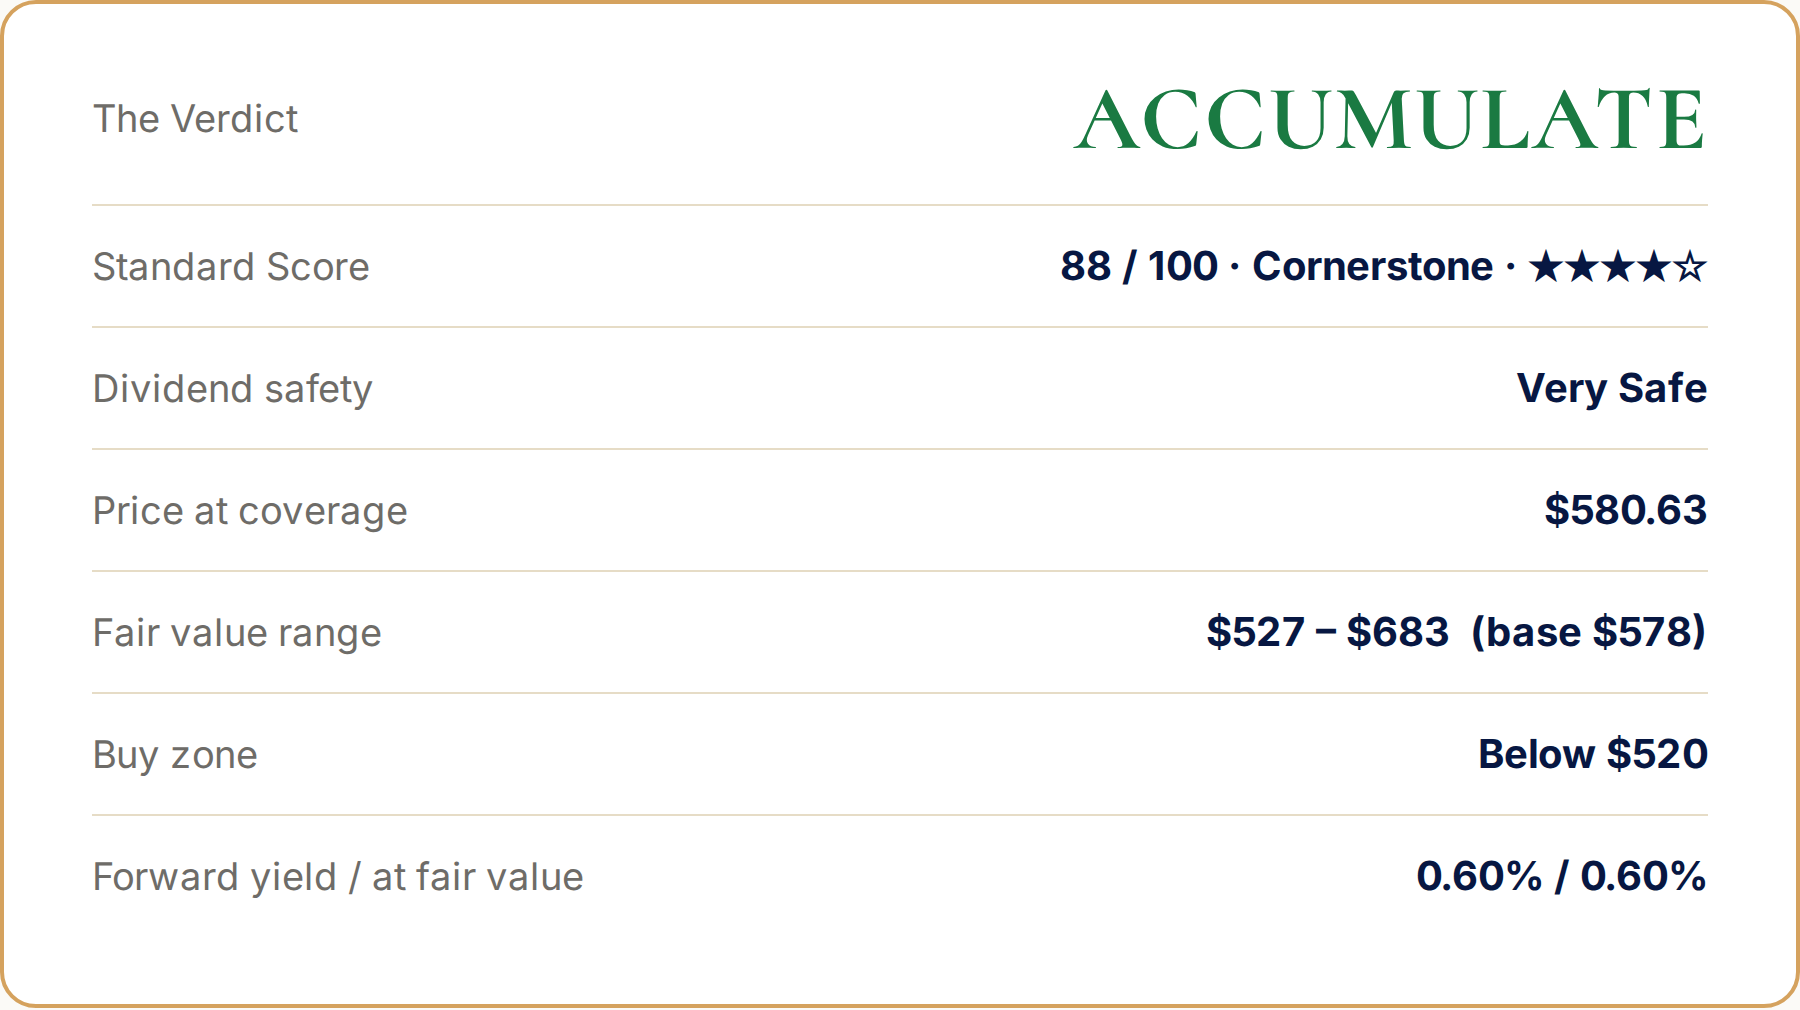
Cornerstone. Accumulate on the way down; the margin of safety starts below $520.
Free cash flow would have to fall by more than 80% before the dividend was even a question — 17% of free cash flow, 26x interest coverage, A+/Aa3, and a business earning eleven times its cost of capital on capital that barely grows.